iPollo B1L vs StrongU STU-U8
Side-by-side specs, profitability, and home mining comparison.
Specifications Comparison
| iPollo B1L | Specification | StrongU STU-U8 |
|---|---|---|
| 58.0 TH/s | Taux de hachage | 46.0 TH/s |
| 3,000 W | Consommation électrique | 2,100 W |
| 51.7 J/TH | Efficiency | 45.7 J/TH |
| — | Niveau de bruit | — |
| 12,700.0 kg | Weight | 8,200.0 kg |
| 10,236 BTU/hr | BTU Output | 7,165 BTU/hr |
| 22/100 | Home Mining Score | 26/100 |
| — | Release Year | — |
| SHA-256 | Algorithme | SHA-256 |
| iPollo | Manufacturer | StrongU |
Profitability Comparison
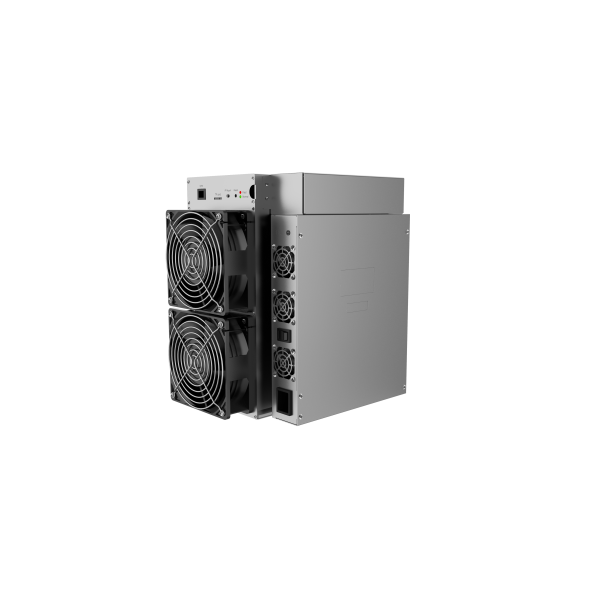
iPollo B1L
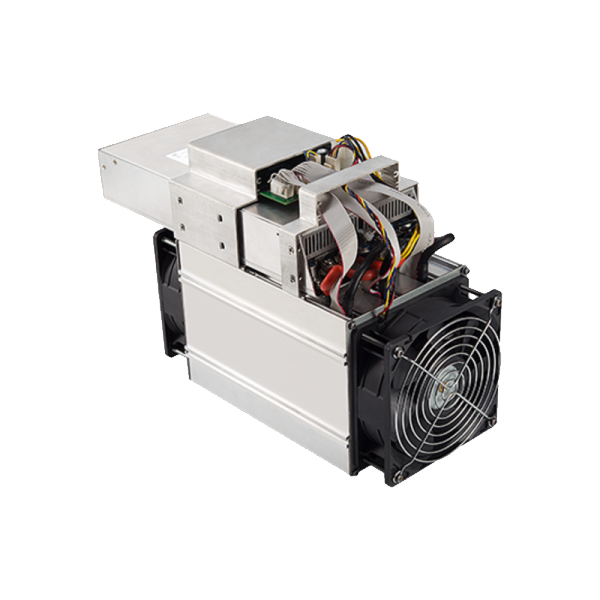
StrongU STU-U8
Based on BTC price of $78,230 and current network difficulty as of May 16, 2026. Actual results vary.
Verdict
Run the numbers across every spec and the StrongU STU-U8 edges it: 3 of 4 factors go its way (efficacité, consommation électrique, score de minage domestique). The standout gap is 30% better power draw (3,000 vs 2,100 W) in the StrongU STU-U8's favour. That said, the iPollo B1L isn't beaten everywhere — it still wins hashrate. Cross-check the spec deltas and ROI table above against your own electricity rate before deciding.
Spec Deltas
The iPollo B1L and StrongU STU-U8 diverge on the metrics below — each gap expressed as a real percentage, not a vague "better":
- iPollo B1L 26% more hashrate (58.0 vs 46.0 TH/s)
- StrongU STU-U8 30% better power draw (3,000 vs 2,100 W)
- StrongU STU-U8 12% better efficacité (51.7 vs 45.7 J/TH)
- StrongU STU-U8 35% better weight (12,700 vs 8,200 kg)
- iPollo B1L 43% more heat output (10,236 vs 7,165 BTU/hr)
- StrongU STU-U8 18% more score de minage domestique (22.0 vs 26.0)
Cost & ROI Over Time
Hardware cost is only half the story — here is how each miner's upfront price plays out against cumulative profit at a $0.10/kWh rate.
| iPollo B1L | Metric | StrongU STU-U8 |
|---|---|---|
| $430 | Upfront cost (MSRP) | — |
| -$5.11 | Daily net profit | -$3.38 |
| -$2,296 | Net after 1 year | -$1,235 |
| -$4,162 | Net after 2 years | -$2,470 |
| -$6,028 | Net after 3 years | -$3,705 |
| Does not pay back at current rates (negative daily profit) | Payback period | — |
Projections assume continuous operation, a flat $0.10/kWh rate, and no hardware degradation, pool fees, or BTC price change. Real-world ROI varies.
Best For...
Best for Profitability
TieBoth miners produce similar daily profit.
Best for Home Mining
StrongU STU-U8Score: 26/100. 0 dB noise level.
Best for Efficiency
StrongU STU-U845.7 J/TH — lower electricity cost per terahash.
Frequently Asked Questions
Which makes more money, the iPollo B1L or the StrongU STU-U8?
At the current BTC price and a $0.10/kWh electricity rate, the StrongU STU-U8 is more profitable at $-3.38/day compared to $-5.11/day for the iPollo B1L. Profitability depends heavily on your electricity rate — use the selector above to calculate with your actual costs.
iPollo B1L vs StrongU STU-U8: which runs at a lower noise level?
Both miners have similar noise levels. Check the specs table above for exact decibel readings.
iPollo B1L vs StrongU STU-U8: which fits a residential setup better?
The StrongU STU-U8 scores 26/100 on our Home Mining Score (vs 22/100 for the iPollo B1L). This composite score factors in noise, power requirements, heat output, size, and setup ease — all critical for residential mining.
iPollo B1L vs StrongU STU-U8: how much does the efficiency gap matter?
The iPollo B1L runs at 51.7 J/TH while the StrongU STU-U8 runs at 45.7 J/TH — a difference of 6.1 J/TH. Lower efficiency means less electricity per terahash of mining power, directly reducing operating costs. In relative terms that is 12% better efficacité (51.7 vs 45.7 J/TH).