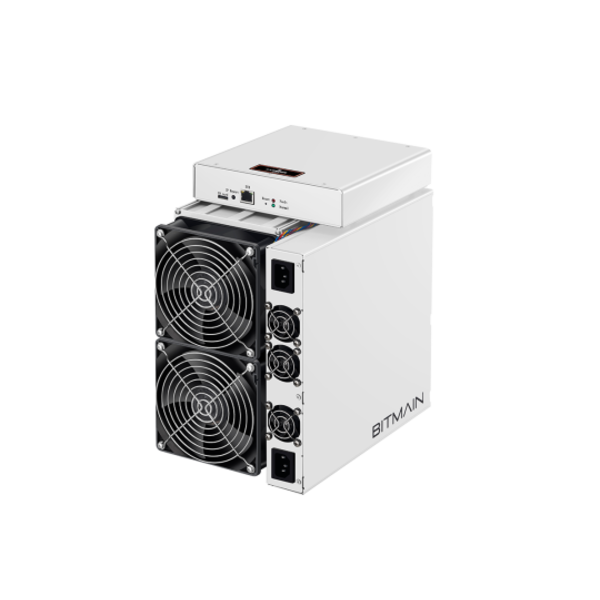
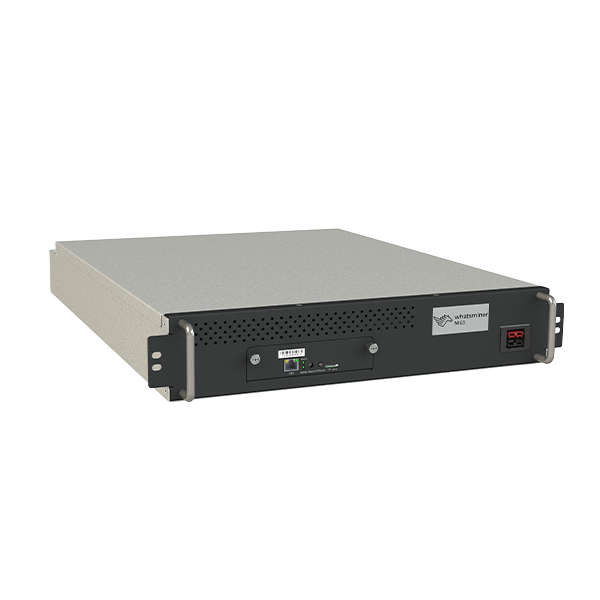
Antminer S17 vs Whatsminer M53
Side-by-side specs, profitability, and home mining comparison.
Specifications Comparison
| Antminer S17 | Specification | Whatsminer M53 |
|---|---|---|
| 56.0 TH/s | Taux de hachage | 226.0 TH/s |
| 2,520 W | Consommation électrique | 6,554 W |
| 45.0 J/TH | Efficiency | 29.0 J/TH |
| 75 dB | Niveau de bruit | 50 dB |
| 9.5 kg | Weight | 27.5 kg |
| 8,598 BTU/hr | BTU Output | 22,362 BTU/hr |
| 84/100 | Home Mining Score | 44/100 |
| — | Release Year | — |
| SHA-256 | Algorithme | SHA-256 |
| Bitmain | Manufacturer | MicroBT |
Profitability Comparison
Antminer S17
Whatsminer M53
Based on BTC price of $78,128 and current network difficulty as of May 17, 2026. Actual results vary.
Verdict
Our scoring model gives the nod to the Whatsminer M53, which leads on 3 of 5 weighted factors (efficacité, hashrate, niveau sonore). The standout gap is 304% more hashrate (56.0 vs 226.0 TH/s) in the Whatsminer M53's favour. The Antminer S17 holds the edge in consommation électrique and score de minage domestique. Cross-check the spec deltas and ROI table above against your own electricity rate before deciding.
Spec Deltas
The Antminer S17 and Whatsminer M53 diverge on the metrics below — each gap expressed as a real percentage, not a vague "better":
- Whatsminer M53 304% more hashrate (56.0 vs 226.0 TH/s)
- Antminer S17 62% better power draw (2,520 vs 6,554 W)
- Whatsminer M53 36% better efficacité (45.0 vs 29.0 J/TH)
- Whatsminer M53 33% better noise (75.0 vs 50.0 dB)
- Antminer S17 65% better weight (9.5 vs 27.5 kg)
- Whatsminer M53 160% more heat output (8,598 vs 22,362 BTU/hr)
- Antminer S17 91% more score de minage domestique (84.0 vs 44.0)
Cost & ROI Over Time
Sticker price versus what the miner actually earns back: the table below projects cumulative net profit at a $0.10/kWh electricity rate.
| Antminer S17 | Metric | Whatsminer M53 |
|---|---|---|
| — | Upfront cost (MSRP) | $7,500 |
| -$4.03 | Daily net profit | -$7.60 |
| -$1,473 | Net after 1 year | -$10,276 |
| -$2,945 | Net after 2 years | -$13,051 |
| -$4,418 | Net after 3 years | -$15,827 |
| — | Payback period | Does not pay back at current rates (negative daily profit) |
Projections assume continuous operation, a flat $0.10/kWh rate, and no hardware degradation, pool fees, or BTC price change. Real-world ROI varies.
Best For...
Best for Profitability
TieBoth miners produce similar daily profit.
Best for Home Mining
Antminer S17Score: 84/100. 75 dB noise level.
Best for Efficiency
Whatsminer M5329.0 J/TH — lower electricity cost per terahash.
Frequently Asked Questions
Is the Antminer S17 or Whatsminer M53 more profitable?
At the current BTC price and a $0.10/kWh electricity rate, the Antminer S17 is more profitable at $-4.03/day compared to $-7.60/day for the Whatsminer M53. Profitability depends heavily on your electricity rate — use the selector above to calculate with your actual costs.
Which is quieter, the Antminer S17 or Whatsminer M53?
The Whatsminer M53 is quieter at 50 dB compared to the Antminer S17 at 75 dB. For home mining, lower noise levels make a significant difference in livability.
Antminer S17 vs Whatsminer M53: which fits a residential setup better?
The Antminer S17 scores 84/100 on our Home Mining Score (vs 44/100 for the Whatsminer M53). This composite score factors in noise, power requirements, heat output, size, and setup ease — all critical for residential mining.
What is the efficiency difference between Antminer S17 and Whatsminer M53?
The Antminer S17 runs at 45.0 J/TH while the Whatsminer M53 runs at 29.0 J/TH — a difference of 16.0 J/TH. Lower efficiency means less electricity per terahash of mining power, directly reducing operating costs. In relative terms that is 36% better efficacité (45.0 vs 29.0 J/TH).