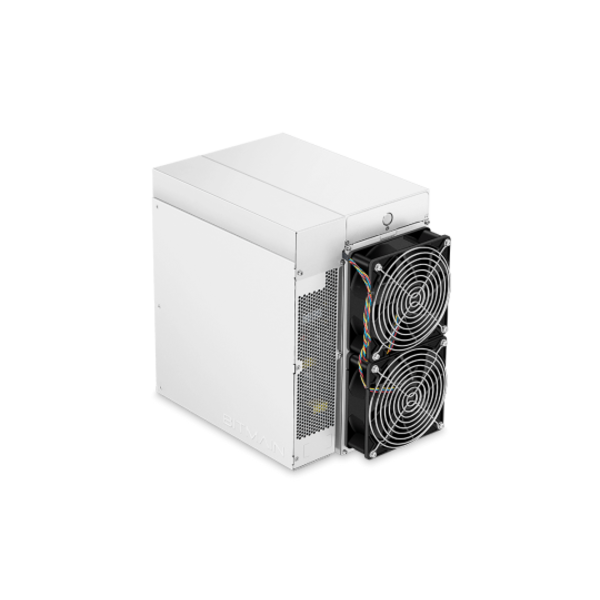
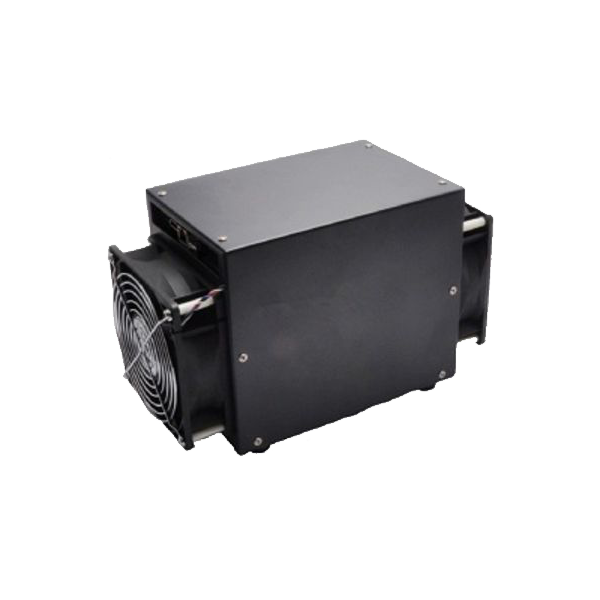
Antminer D7 vs PinIdea DR-3
Side-by-side specs, profitability, and home mining comparison.
Specifications Comparison
| Antminer D7 | Specification | PinIdea DR-3 |
|---|---|---|
| 1,286.0 GH/s | Taux de hachage | 600.0 MH/s |
| 3,148 W | Consommation électrique | 345 W |
| 2,447.9 J/TH | Efficiency | 575,000.0 J/TH |
| 70 dB | Niveau de bruit | — |
| 14.4 kg | Weight | — |
| 10,741 BTU/hr | BTU Output | 1,177 BTU/hr |
| 36/100 | Home Mining Score | 34/100 |
| — | Release Year | — |
| X11 | Algorithme | X11 |
| Bitmain | Manufacturer | PinIdea |
Profitability Comparison
Antminer D7
PinIdea DR-3
Based on BTC price of $78,237 and current network difficulty as of May 16, 2026. Actual results vary.
Verdict
Weighing six performance factors, the Antminer D7 comes out ahead — it takes 4 of 5 (efficacité, hashrate, score de minage domestique, niveau sonore). The standout gap is 214233% more hashrate (1.3 vs 0.0 TH/s) in the Antminer D7's favour. That said, the PinIdea DR-3 isn't beaten everywhere — it still wins consommation électrique. Review the detailed specs and profitability calculations above to determine which miner best fits your specific setup.
Spec Deltas
The Antminer D7 and PinIdea DR-3 diverge on the metrics below — each gap expressed as a real percentage, not a vague "better":
- Antminer D7 214233% more hashrate (1.3 vs 0.0 TH/s)
- PinIdea DR-3 89% better power draw (3,148 vs 345 W)
- Antminer D7 100% better efficacité (2,448 vs 575,000 J/TH)
- Antminer D7 812% more heat output (10,741 vs 1,177 BTU/hr)
- Antminer D7 6% more score de minage domestique (36.0 vs 34.0)
Cost & ROI Over Time
A miner pays for itself in profit, not specs. These projections track upfront cost against one, two and three years of net earnings at $0.10/kWh.
| Antminer D7 | Metric | PinIdea DR-3 |
|---|---|---|
| $2,500 | Upfront cost (MSRP) | — |
| -$7.51 | Daily net profit | -$0.83 |
| -$5,241 | Net after 1 year | -$302 |
| -$7,981 | Net after 2 years | -$604 |
| -$10,722 | Net after 3 years | -$907 |
| Does not pay back at current rates (negative daily profit) | Payback period | — |
Projections assume continuous operation, a flat $0.10/kWh rate, and no hardware degradation, pool fees, or BTC price change. Real-world ROI varies.
Best For...
Best for Profitability
TieBoth miners produce similar daily profit.
Best for Home Mining
Antminer D7Score: 36/100. 70 dB noise level.
Best for Efficiency
Antminer D72,447.9 J/TH — lower electricity cost per terahash.
Frequently Asked Questions
Which makes more money, the Antminer D7 or the PinIdea DR-3?
At the current BTC price and a $0.10/kWh electricity rate, the PinIdea DR-3 is more profitable at $-0.83/day compared to $-7.51/day for the Antminer D7. Profitability depends heavily on your electricity rate — use the selector above to calculate with your actual costs.
Antminer D7 vs PinIdea DR-3: which runs at a lower noise level?
The Antminer D7 is quieter at 70 dB compared to the PinIdea DR-3 at 0 dB. For home mining, lower noise levels make a significant difference in livability.
For mining at home, should I pick the Antminer D7 or the PinIdea DR-3?
The Antminer D7 scores 36/100 on our Home Mining Score (vs 34/100 for the PinIdea DR-3). This composite score factors in noise, power requirements, heat output, size, and setup ease — all critical for residential mining.
How far apart are the Antminer D7 and PinIdea DR-3 on J/TH?
The Antminer D7 runs at 2,447.9 J/TH while the PinIdea DR-3 runs at 575,000.0 J/TH — a difference of 572,552.1 J/TH. Lower efficiency means less electricity per terahash of mining power, directly reducing operating costs. In relative terms that is 100% better efficacité (2,448 vs 575,000 J/TH).