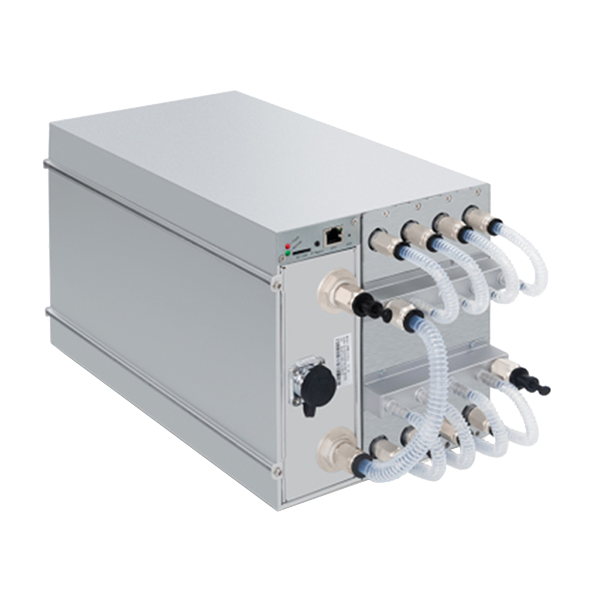
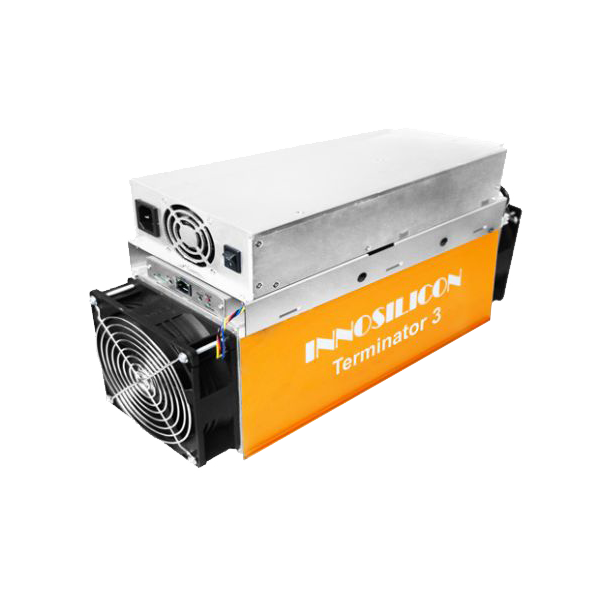
Antminer S19 Pro+ Hyd vs Innosilicon T3+
Side-by-side specs, profitability, and home mining comparison.
Specifications Comparison
| Antminer S19 Pro+ Hyd | Specification | Innosilicon T3+ |
|---|---|---|
| 198.0 TH/s | Taux de hachage | 67.0 TH/s |
| 5,445 W | Consommation électrique | 3,300 W |
| 27.5 J/TH | Efficiency | 49.3 J/TH |
| 50 dB | Niveau de bruit | 75 dB |
| 15.0 kg | Weight | 12.0 kg |
| 18,578 BTU/hr | BTU Output | 11,260 BTU/hr |
| 44/100 | Home Mining Score | 36/100 |
| — | Release Year | — |
| SHA-256 | Algorithme | SHA-256 |
| Bitmain | Manufacturer | Innosilicon |
Profitability Comparison
Antminer S19 Pro+ Hyd
Innosilicon T3+
Based on BTC price of $78,185 and current network difficulty as of May 16, 2026. Actual results vary.
Verdict
Selon notre analyse multifactorielle, le Antminer S19 Pro+ Hyd l'emporte sur 4 des 6 facteurs (efficacité, hashrate, score de minage domestique, niveau sonore). Where it pulls away hardest is 196% more hashrate (198.0 vs 67.0 TH/s). The Innosilicon T3+ holds the edge in consommation électrique and rapport qualité-prix. The right pick still depends on your power cost and noise tolerance — the breakdowns above make that call concrete.
Spec Deltas
Here is every spec where the Antminer S19 Pro+ Hyd and Innosilicon T3+ actually differ, with the gap quantified:
- Antminer S19 Pro+ Hyd 196% more hashrate (198.0 vs 67.0 TH/s)
- Innosilicon T3+ 39% better power draw (5,445 vs 3,300 W)
- Antminer S19 Pro+ Hyd 44% better efficacité (27.5 vs 49.3 J/TH)
- Antminer S19 Pro+ Hyd 33% better noise (50.0 vs 75.0 dB)
- Innosilicon T3+ 20% better weight (15.0 vs 12.0 kg)
- Antminer S19 Pro+ Hyd 65% more heat output (18,578 vs 11,260 BTU/hr)
- Antminer S19 Pro+ Hyd 22% more score de minage domestique (44.0 vs 36.0)
Cost & ROI Over Time
Sticker price versus what the miner actually earns back: the table below projects cumulative net profit at a $0.10/kWh electricity rate.
| Antminer S19 Pro+ Hyd | Metric | Innosilicon T3+ |
|---|---|---|
| $6,000 | Upfront cost (MSRP) | $1,200 |
| -$5.94 | Daily net profit | -$5.51 |
| -$8,170 | Net after 1 year | -$3,211 |
| -$10,339 | Net after 2 years | -$5,222 |
| -$12,509 | Net after 3 years | -$7,233 |
| Does not pay back at current rates (negative daily profit) | Payback period | Does not pay back at current rates (negative daily profit) |
Projections assume continuous operation, a flat $0.10/kWh rate, and no hardware degradation, pool fees, or BTC price change. Real-world ROI varies.
Best For...
Best for Profitability
TieBoth miners produce similar daily profit.
Best for Home Mining
Antminer S19 Pro+ HydScore: 44/100. 50 dB noise level.
Best for Efficiency
Antminer S19 Pro+ Hyd27.5 J/TH — lower electricity cost per terahash.
Frequently Asked Questions
Is the Antminer S19 Pro+ Hyd or Innosilicon T3+ more profitable?
At the current BTC price and a $0.10/kWh electricity rate, the Innosilicon T3+ is more profitable at $-5.51/day compared to $-5.94/day for the Antminer S19 Pro+ Hyd. Profitability depends heavily on your electricity rate — use the selector above to calculate with your actual costs.
Antminer S19 Pro+ Hyd vs Innosilicon T3+: which runs at a lower noise level?
The Antminer S19 Pro+ Hyd is quieter at 50 dB compared to the Innosilicon T3+ at 75 dB. For home mining, lower noise levels make a significant difference in livability.
For mining at home, should I pick the Antminer S19 Pro+ Hyd or the Innosilicon T3+?
The Antminer S19 Pro+ Hyd scores 44/100 on our Home Mining Score (vs 36/100 for the Innosilicon T3+). This composite score factors in noise, power requirements, heat output, size, and setup ease — all critical for residential mining.
What is the efficiency difference between Antminer S19 Pro+ Hyd and Innosilicon T3+?
The Antminer S19 Pro+ Hyd runs at 27.5 J/TH while the Innosilicon T3+ runs at 49.3 J/TH — a difference of 21.8 J/TH. Lower efficiency means less electricity per terahash of mining power, directly reducing operating costs. In relative terms that is 44% better efficacité (27.5 vs 49.3 J/TH).