-

Accessories46 Products
-
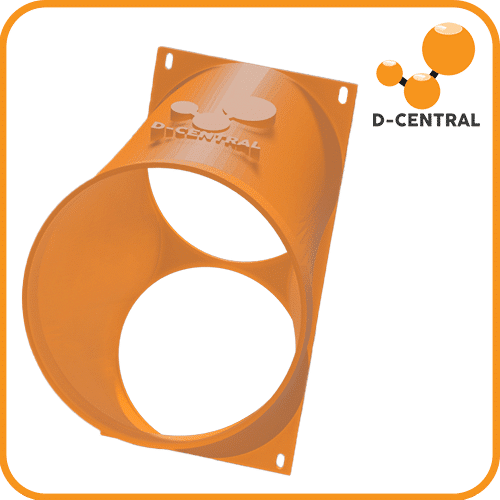
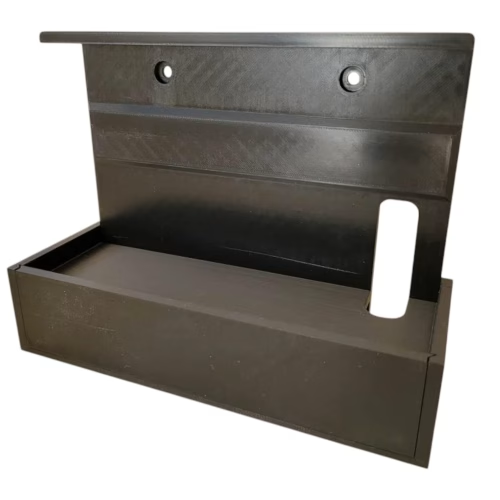
Adapters and Shrouds21 Products
-

ASIC Chips62 Products
-

Bitcoin Mining Heaters9 Products
-
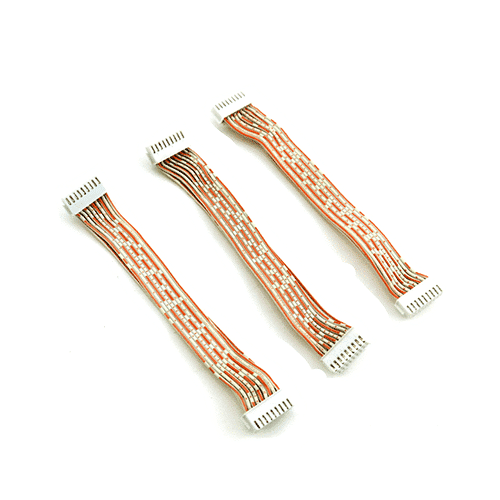
Cables and Connectors23 Products
-
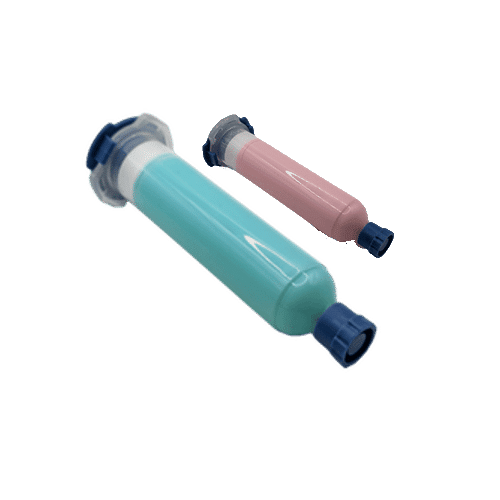
Consumables12 Products
-
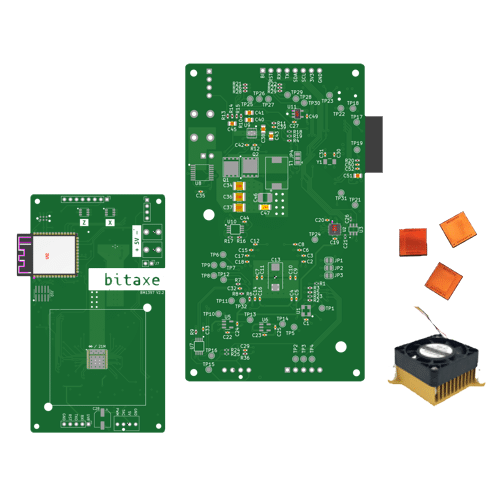
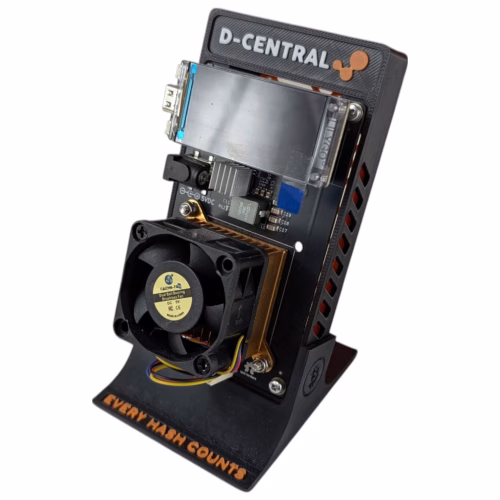
DIY Kits10 Products
-
Gaming Gear1 Product
-
Merchandise110 Products
-
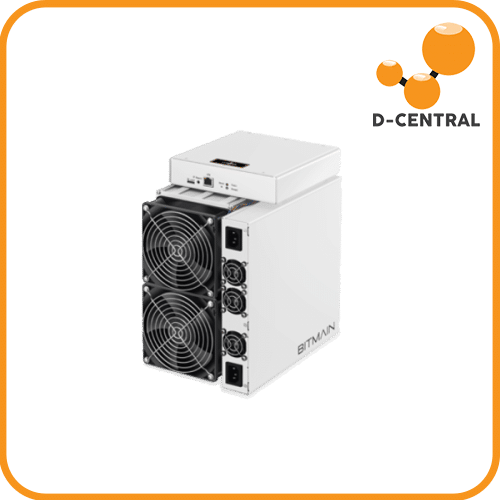
Mining Hardware41 Products
-
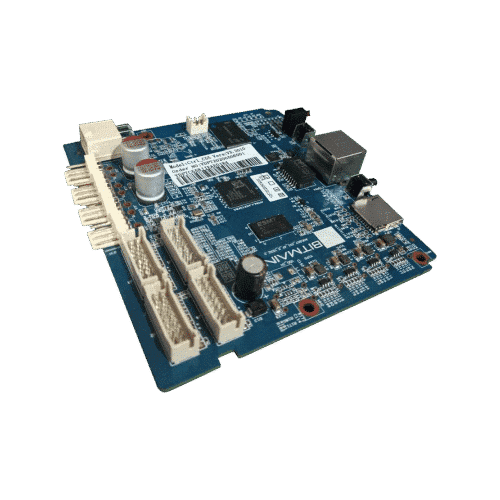
Mining Hardware Parts64 Products
-
Open Source17 Products
-
Others8 Products
-
Pleb Mining46 Products
-
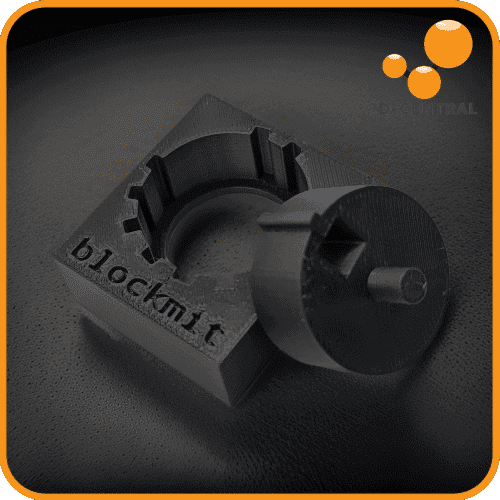
Tools28 Products