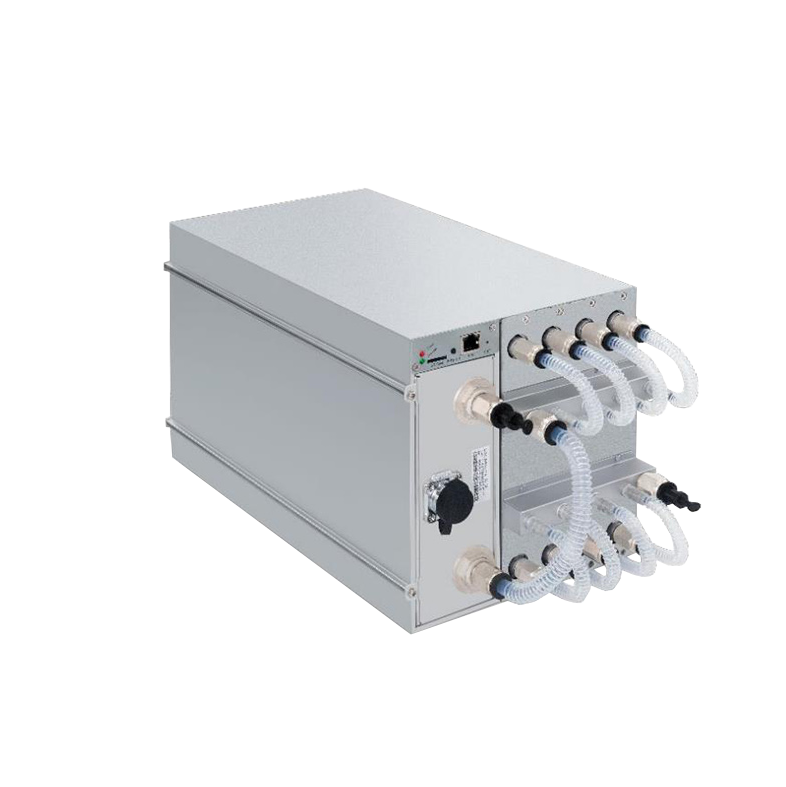
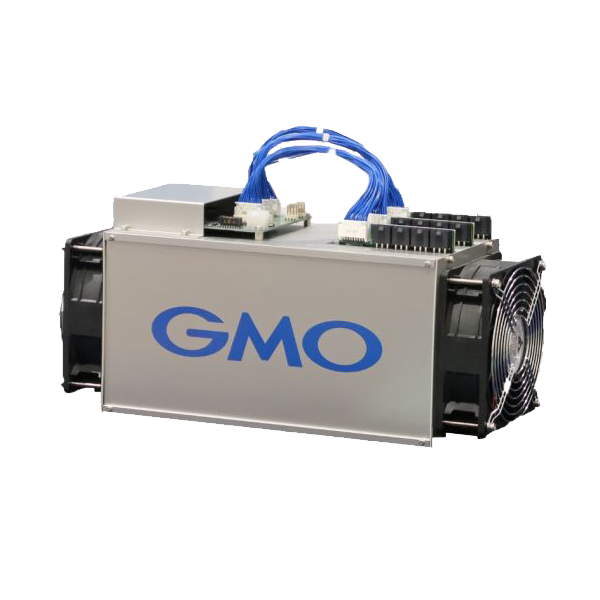
Antminer S19 XP Hyd vs GMO miner B2
Side-by-side specs, profitability, and home mining comparison.
Specifications Comparison
| Antminer S19 XP Hyd | Specification | GMO miner B2 |
|---|---|---|
| 255.0 TH/s | Taux de hachage | 24.0 TH/s |
| 5,304 W | Consommation électrique | 1,950 W |
| 20.8 J/TH | Efficiency | 81.3 J/TH |
| 50 dB | Niveau de bruit | — |
| 13.1 kg | Weight | — |
| 18,097 BTU/hr | BTU Output | 6,653 BTU/hr |
| 44/100 | Home Mining Score | 28/100 |
| — | Release Year | — |
| SHA-256 | Algorithme | SHA-256 |
| Bitmain | Manufacturer | GMO miner |
Profitability Comparison
Antminer S19 XP Hyd
GMO miner B2
Based on BTC price of $76,922 and current network difficulty as of May 18, 2026. Actual results vary.
Verdict
Our scoring model gives the nod to the Antminer S19 XP Hyd, which leads on 4 of 5 weighted factors (efficacité, hashrate, score de minage domestique, niveau sonore). Its biggest concrete edge: 963% more hashrate (255.0 vs 24.0 TH/s). The GMO miner B2 claws back ground on consommation électrique. Review the detailed specs and profitability calculations above to determine which miner best fits your specific setup.
Spec Deltas
The Antminer S19 XP Hyd and GMO miner B2 diverge on the metrics below — each gap expressed as a real percentage, not a vague "better":
- Antminer S19 XP Hyd 963% more hashrate (255.0 vs 24.0 TH/s)
- GMO miner B2 63% better power draw (5,304 vs 1,950 W)
- Antminer S19 XP Hyd 74% better efficacité (20.8 vs 81.3 J/TH)
- Antminer S19 XP Hyd 172% more heat output (18,097 vs 6,653 BTU/hr)
- Antminer S19 XP Hyd 57% more score de minage domestique (44.0 vs 28.0)
Cost & ROI Over Time
A miner pays for itself in profit, not specs. These projections track upfront cost against one, two and three years of net earnings at $0.10/kWh.
| Antminer S19 XP Hyd | Metric | GMO miner B2 |
|---|---|---|
| $6,500 | Upfront cost (MSRP) | — |
| -$3.70 | Daily net profit | -$3.83 |
| -$7,852 | Net after 1 year | -$1,398 |
| -$9,203 | Net after 2 years | -$2,796 |
| -$10,555 | Net after 3 years | -$4,194 |
| Does not pay back at current rates (negative daily profit) | Payback period | — |
Projections assume continuous operation, a flat $0.10/kWh rate, and no hardware degradation, pool fees, or BTC price change. Real-world ROI varies.
Best For...
Best for Profitability
TieBoth miners produce similar daily profit.
Best for Home Mining
Antminer S19 XP HydScore: 44/100. 50 dB noise level.
Best for Efficiency
Antminer S19 XP Hyd20.8 J/TH — lower electricity cost per terahash.
Frequently Asked Questions
Is the Antminer S19 XP Hyd or GMO miner B2 more profitable?
At the current BTC price and a $0.10/kWh electricity rate, the Antminer S19 XP Hyd is more profitable at $-3.70/day compared to $-3.83/day for the GMO miner B2. Profitability depends heavily on your electricity rate — use the selector above to calculate with your actual costs.
Antminer S19 XP Hyd vs GMO miner B2: which runs at a lower noise level?
The Antminer S19 XP Hyd is quieter at 50 dB compared to the GMO miner B2 at 0 dB. For home mining, lower noise levels make a significant difference in livability.
Which is better for home mining, the Antminer S19 XP Hyd or GMO miner B2?
The Antminer S19 XP Hyd scores 44/100 on our Home Mining Score (vs 28/100 for the GMO miner B2). This composite score factors in noise, power requirements, heat output, size, and setup ease — all critical for residential mining.
What is the efficiency difference between Antminer S19 XP Hyd and GMO miner B2?
The Antminer S19 XP Hyd runs at 20.8 J/TH while the GMO miner B2 runs at 81.3 J/TH — a difference of 60.5 J/TH. Lower efficiency means less electricity per terahash of mining power, directly reducing operating costs. In relative terms that is 74% better efficacité (20.8 vs 81.3 J/TH).