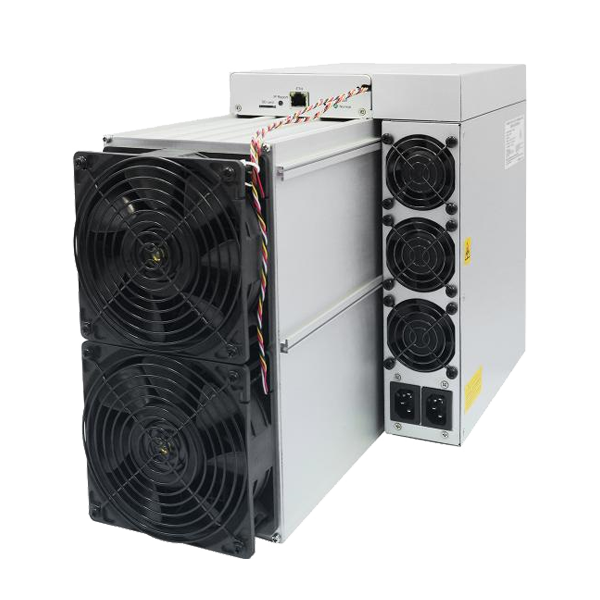
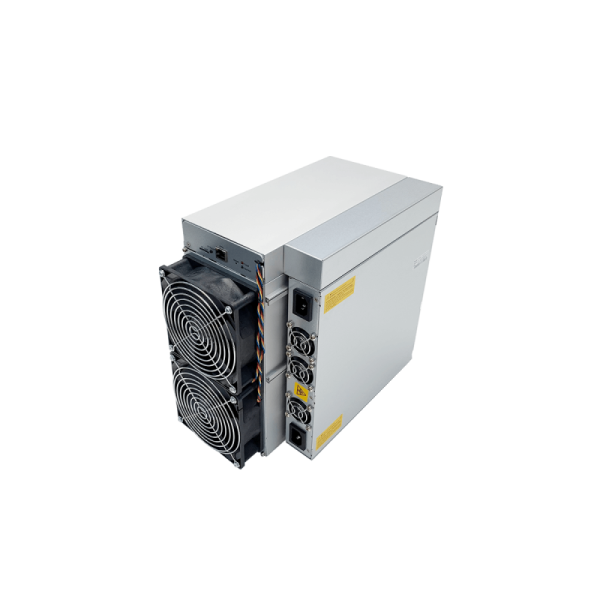
Antminer E9 Pro vs Bitmain Antminer S19j Pro (104Th)
Side-by-side specs, profitability, and home mining comparison.
Specifications Comparison
| Antminer E9 Pro | Specification | Bitmain Antminer S19j Pro (104Th) |
|---|---|---|
| 3,680.0 MH/s | Hashrate | 104.0 TH/s |
| 2,200 W | Power Consumption | 3,068 W |
| 597,826.1 J/TH | Efficiency | 29.5 J/TH |
| 75 dB | Noise Level | — |
| 14.2 kg | Weight | 13,200.0 kg |
| 7,506 BTU/hr | BTU Output | 10,468 BTU/hr |
| 40/100 | Home Mining Score | 22/100 |
| — | Release Year | — |
| EtHash | Algorithm | SHA-256 |
| Bitmain | Manufacturer | Bitmain |
Profitability Comparison
Antminer E9 Pro
Bitmain Antminer S19j Pro (104Th)
Based on BTC price of $79,051 and current network difficulty as of May 15, 2026. Actual results vary.
Verdict
Weighing six performance factors, the Bitmain Antminer S19j Pro (104Th) comes out ahead — it takes 3 of 6 (efficiency, hashrate, price-performance). Where it pulls away hardest is 2825987% more hashrate (0.0 vs 104.0 TH/s). The Antminer E9 Pro holds the edge in power consumption and home mining score and noise level. Review the detailed specs and profitability calculations above to determine which miner best fits your specific setup.
Spec Deltas
Here is every spec where the Antminer E9 Pro and Bitmain Antminer S19j Pro (104Th) actually differ, with the gap quantified:
- Bitmain Antminer S19j Pro (104Th) 2825987% more hashrate (0.0 vs 104.0 TH/s)
- Antminer E9 Pro 28% better power draw (2,200 vs 3,068 W)
- Bitmain Antminer S19j Pro (104Th) 100% better efficiency (597,826.1 vs 29.5 J/TH)
- Antminer E9 Pro 100% better weight (14.2 vs 13,200.0 kg)
- Bitmain Antminer S19j Pro (104Th) 39% more heat output (7,506 vs 10,468 BTU/hr)
- Antminer E9 Pro 82% more home mining score (40.0 vs 22.0)
Cost & ROI Over Time
Sticker price versus what the miner actually earns back: the table below projects cumulative net profit at a $0.10/kWh electricity rate.
| Antminer E9 Pro | Metric | Bitmain Antminer S19j Pro (104Th) |
|---|---|---|
| $3,000 | Upfront cost (MSRP) | $398 |
| -$5.28 | Daily net profit | -$3.58 |
| -$4,927 | Net after 1 year | -$1,705 |
| -$6,854 | Net after 2 years | -$3,011 |
| -$8,781 | Net after 3 years | -$4,318 |
| Does not pay back at current rates (negative daily profit) | Payback period | Does not pay back at current rates (negative daily profit) |
Projections assume continuous operation, a flat $0.10/kWh rate, and no hardware degradation, pool fees, or BTC price change. Real-world ROI varies.
Best For...
Best for Profitability
TieBoth miners produce similar daily profit.
Best for Home Mining
Antminer E9 ProScore: 40/100. 75 dB noise level.
Best for Efficiency
Bitmain Antminer S19j Pro (104Th)29.5 J/TH — lower electricity cost per terahash.
Frequently Asked Questions
Which makes more money, the Antminer E9 Pro or the Bitmain Antminer S19j Pro (104Th)?
At the current BTC price and a $0.10/kWh electricity rate, the Bitmain Antminer S19j Pro (104Th) is more profitable at $-3.58/day compared to $-5.28/day for the Antminer E9 Pro. Profitability depends heavily on your electricity rate — use the selector above to calculate with your actual costs.
Is the Antminer E9 Pro or the Bitmain Antminer S19j Pro (104Th) better for noise-sensitive spaces?
The Antminer E9 Pro is quieter at 75 dB compared to the Bitmain Antminer S19j Pro (104Th) at 0 dB. For home mining, lower noise levels make a significant difference in livability.
Which is better for home mining, the Antminer E9 Pro or Bitmain Antminer S19j Pro (104Th)?
The Antminer E9 Pro scores 40/100 on our Home Mining Score (vs 22/100 for the Bitmain Antminer S19j Pro (104Th)). This composite score factors in noise, power requirements, heat output, size, and setup ease — all critical for residential mining.
How far apart are the Antminer E9 Pro and Bitmain Antminer S19j Pro (104Th) on J/TH?
The Antminer E9 Pro runs at 597,826.1 J/TH while the Bitmain Antminer S19j Pro (104Th) runs at 29.5 J/TH — a difference of 597,796.6 J/TH. Lower efficiency means less electricity per terahash of mining power, directly reducing operating costs. In relative terms that is 100% better efficiency (597,826.1 vs 29.5 J/TH).