Antminer S21 XP vs Whatsminer M53S
Side-by-side specs, profitability, and home mining comparison.
Specifications Comparison
| Antminer S21 XP | Specification | Whatsminer M53S |
|---|---|---|
| 270.0 TH/s | Hashrate | 260.0 TH/s |
| 3,645 W | Power Consumption | 6,760 W |
| 13.5 J/TH | Efficiency | 26.0 J/TH |
| 75 dB | Noise Level | 50 dB |
| 15.4 kg | Weight | 27.5 kg |
| 12,437 BTU/hr | BTU Output | 23,065 BTU/hr |
| 30/100 | Home Mining Score | 44/100 |
| — | Release Year | — |
| SHA-256 | Algorithm | SHA-256 |
| Bitmain | Manufacturer | MicroBT |
Profitability Comparison
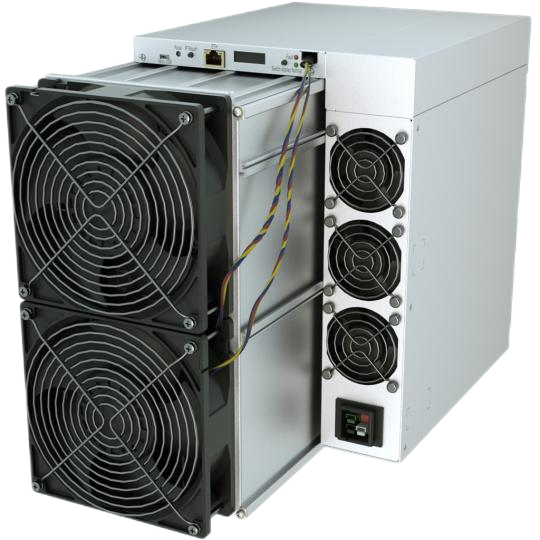
Antminer S21 XP
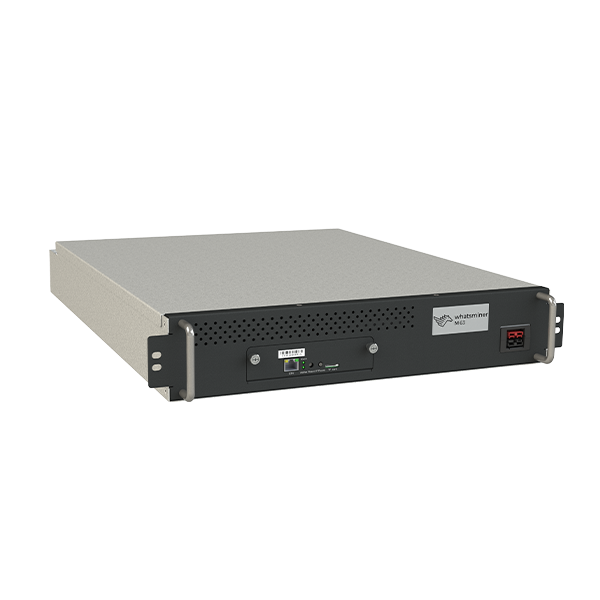
Whatsminer M53S
Based on BTC price of $79,091 and current network difficulty as of May 15, 2026. Actual results vary.
Verdict
Weighing six performance factors, the Antminer S21 XP comes out ahead — it takes 4 of 6 (efficiency, hashrate, power consumption, price-performance). Its biggest concrete edge: 48% better efficiency (13.5 vs 26.0 J/TH). The Whatsminer M53S claws back ground on home mining score and noise level. Cross-check the spec deltas and ROI table above against your own electricity rate before deciding.
Spec Deltas
Here is every spec where the Antminer S21 XP and Whatsminer M53S actually differ, with the gap quantified:
- Antminer S21 XP 4% more hashrate (270 vs 260 TH/s)
- Antminer S21 XP 46% better power draw (3,645 vs 6,760 W)
- Antminer S21 XP 48% better efficiency (13.5 vs 26.0 J/TH)
- Whatsminer M53S 33% better noise (75.0 vs 50.0 dB)
- Antminer S21 XP 44% better weight (15.4 vs 27.5 kg)
- Whatsminer M53S 85% more heat output (12,437 vs 23,065 BTU/hr)
- Whatsminer M53S 47% more home mining score (30.0 vs 44.0)
Cost & ROI Over Time
Sticker price versus what the miner actually earns back: the table below projects cumulative net profit at a $0.10/kWh electricity rate.
| Antminer S21 XP | Metric | Whatsminer M53S |
|---|---|---|
| $8,200 | Upfront cost (MSRP) | $8,500 |
| $1.08 | Daily net profit | -$6.76 |
| -$7,806 | Net after 1 year | -$10,968 |
| -$7,412 | Net after 2 years | -$13,435 |
| -$7,018 | Net after 3 years | -$15,903 |
| Takes ~20.8 years to pay back at current rates | Payback period | Does not pay back at current rates (negative daily profit) |
Projections assume continuous operation, a flat $0.10/kWh rate, and no hardware degradation, pool fees, or BTC price change. Real-world ROI varies.
Best For...
Best for Profitability
Antminer S21 XP$7.84/day higher profit at current rates.
Best for Home Mining
Whatsminer M53SScore: 44/100. 50 dB noise level.
Best for Efficiency
Antminer S21 XP13.5 J/TH — lower electricity cost per terahash.
Frequently Asked Questions
Antminer S21 XP vs Whatsminer M53S: which one earns more per day?
At the current BTC price and a $0.10/kWh electricity rate, the Antminer S21 XP is more profitable at $1.08/day compared to $-6.76/day for the Whatsminer M53S. Profitability depends heavily on your electricity rate — use the selector above to calculate with your actual costs.
Which is quieter, the Antminer S21 XP or Whatsminer M53S?
The Whatsminer M53S is quieter at 50 dB compared to the Antminer S21 XP at 75 dB. For home mining, lower noise levels make a significant difference in livability.
Which is better for home mining, the Antminer S21 XP or Whatsminer M53S?
The Whatsminer M53S scores 44/100 on our Home Mining Score (vs 30/100 for the Antminer S21 XP). This composite score factors in noise, power requirements, heat output, size, and setup ease — all critical for residential mining.
Antminer S21 XP vs Whatsminer M53S: how much does the efficiency gap matter?
The Antminer S21 XP runs at 13.5 J/TH while the Whatsminer M53S runs at 26.0 J/TH — a difference of 12.5 J/TH. Lower efficiency means less electricity per terahash of mining power, directly reducing operating costs. In relative terms that is 48% better efficiency (13.5 vs 26.0 J/TH).