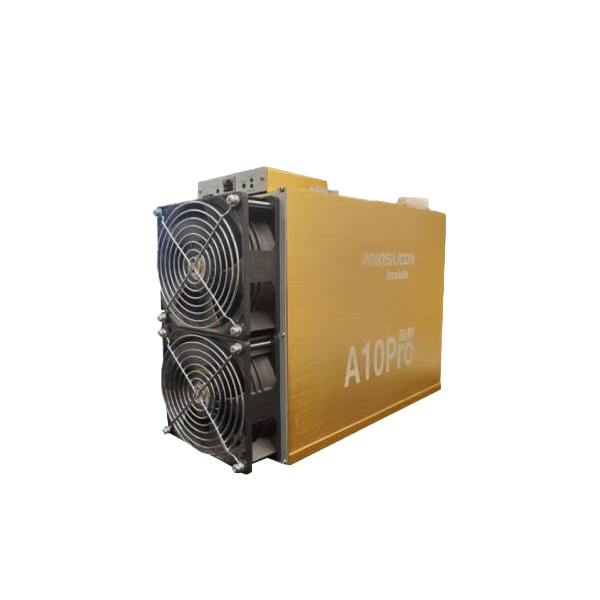
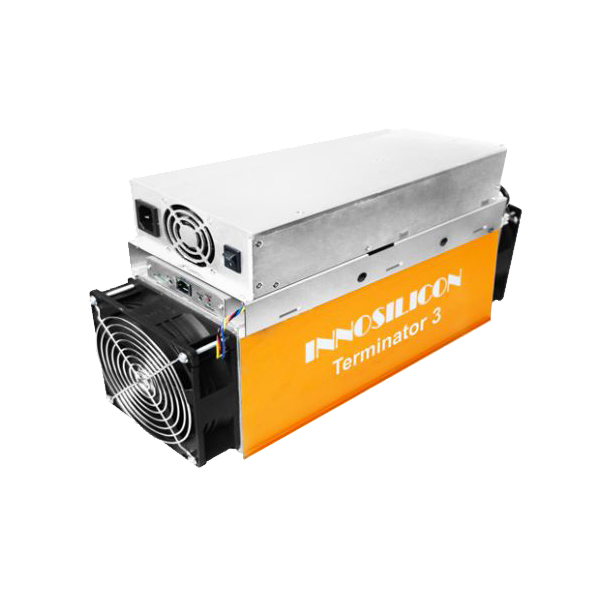
Innosilicon A10 Pro+ ETH (750Mh) vs Innosilicon T3 43T
Side-by-side specs, profitability, and home mining comparison.
Specifications Comparison
| Innosilicon A10 Pro+ ETH (750Mh) | Specification | Innosilicon T3 43T |
|---|---|---|
| 750.0 MH/s | Hashrate | 43.0 TH/s |
| 1,350 W | Power Consumption | 2,100 W |
| 1,800,000.0 J/TH | Efficiency | 48.8 J/TH |
| — | Noise Level | — |
| 8,100.0 kg | Weight | 10,000.0 kg |
| 4,606 BTU/hr | BTU Output | 7,165 BTU/hr |
| 31/100 | Home Mining Score | 26/100 |
| — | Release Year | — |
| EtHash | Algorithm | SHA-256 |
| Innosilicon | Manufacturer | Innosilicon |
Profitability Comparison
Innosilicon A10 Pro+ ETH (750Mh)
Innosilicon T3 43T
Based on BTC price of $79,227 and current network difficulty as of May 15, 2026. Actual results vary.
Verdict
Based on our multi-factor analysis, the Innosilicon T3 43T wins on 3 of 5 factors (efficiency, hashrate, price-performance). Where it pulls away hardest is 5733233% more hashrate (0.0 vs 43.0 TH/s). That said, the Innosilicon A10 Pro+ ETH (750Mh) isn't beaten everywhere — it still wins power consumption and home mining score. Cross-check the spec deltas and ROI table above against your own electricity rate before deciding.
Spec Deltas
Here is every spec where the Innosilicon A10 Pro+ ETH (750Mh) and Innosilicon T3 43T actually differ, with the gap quantified:
- Innosilicon T3 43T 5733233% more hashrate (0.0 vs 43.0 TH/s)
- Innosilicon A10 Pro+ ETH (750Mh) 36% better power draw (1,350 vs 2,100 W)
- Innosilicon T3 43T 100% better efficiency (1,800,000.0 vs 48.8 J/TH)
- Innosilicon A10 Pro+ ETH (750Mh) 19% better weight (8,100 vs 10,000 kg)
- Innosilicon T3 43T 56% more heat output (4,606 vs 7,165 BTU/hr)
- Innosilicon A10 Pro+ ETH (750Mh) 19% more home mining score (31.0 vs 26.0)
Cost & ROI Over Time
Sticker price versus what the miner actually earns back: the table below projects cumulative net profit at a $0.10/kWh electricity rate.
| Innosilicon A10 Pro+ ETH (750Mh) | Metric | Innosilicon T3 43T |
|---|---|---|
| $800 | Upfront cost (MSRP) | $1,500 |
| -$3.24 | Daily net profit | -$3.42 |
| -$1,983 | Net after 1 year | -$2,750 |
| -$3,165 | Net after 2 years | -$3,999 |
| -$4,348 | Net after 3 years | -$5,249 |
| Does not pay back at current rates (negative daily profit) | Payback period | Does not pay back at current rates (negative daily profit) |
Projections assume continuous operation, a flat $0.10/kWh rate, and no hardware degradation, pool fees, or BTC price change. Real-world ROI varies.
Best For...
Best for Profitability
TieBoth miners produce similar daily profit.
Best for Home Mining
Innosilicon A10 Pro+ ETH (750Mh)Score: 31/100. 0 dB noise level.
Best for Efficiency
Innosilicon T3 43T48.8 J/TH — lower electricity cost per terahash.
Frequently Asked Questions
Innosilicon A10 Pro+ ETH (750Mh) vs Innosilicon T3 43T: which one earns more per day?
At the current BTC price and a $0.10/kWh electricity rate, the Innosilicon A10 Pro+ ETH (750Mh) is more profitable at $-3.24/day compared to $-3.42/day for the Innosilicon T3 43T. Profitability depends heavily on your electricity rate — use the selector above to calculate with your actual costs.
Which is quieter, the Innosilicon A10 Pro+ ETH (750Mh) or Innosilicon T3 43T?
Both miners have similar noise levels. Check the specs table above for exact decibel readings.
For mining at home, should I pick the Innosilicon A10 Pro+ ETH (750Mh) or the Innosilicon T3 43T?
The Innosilicon A10 Pro+ ETH (750Mh) scores 31/100 on our Home Mining Score (vs 26/100 for the Innosilicon T3 43T). This composite score factors in noise, power requirements, heat output, size, and setup ease — all critical for residential mining.
Innosilicon A10 Pro+ ETH (750Mh) vs Innosilicon T3 43T: how much does the efficiency gap matter?
The Innosilicon A10 Pro+ ETH (750Mh) runs at 1,800,000.0 J/TH while the Innosilicon T3 43T runs at 48.8 J/TH — a difference of 1,799,951.2 J/TH. Lower efficiency means less electricity per terahash of mining power, directly reducing operating costs. In relative terms that is 100% better efficiency (1,800,000.0 vs 48.8 J/TH).
Compare Innosilicon A10 Pro+ ETH (750Mh) with...
- Innosilicon A10 Pro+ ETH (750Mh) vs Innosilicon A10 ETHMaster (500Mh)
- Innosilicon A10 Pro+ ETH (750Mh) vs Innosilicon A10 Pro ETH (500Mh)
- Innosilicon A10 Pro+ ETH (750Mh) vs Innosilicon A11 Pro
- Innosilicon A10 Pro+ ETH (750Mh) vs Innosilicon A11 Pro ETH (1500Mh)
- Innosilicon A10 Pro+ ETH (750Mh) vs Innosilicon A4 Dominator
- Innosilicon A10 Pro+ ETH (750Mh) vs Innosilicon A4+ LTCMaster