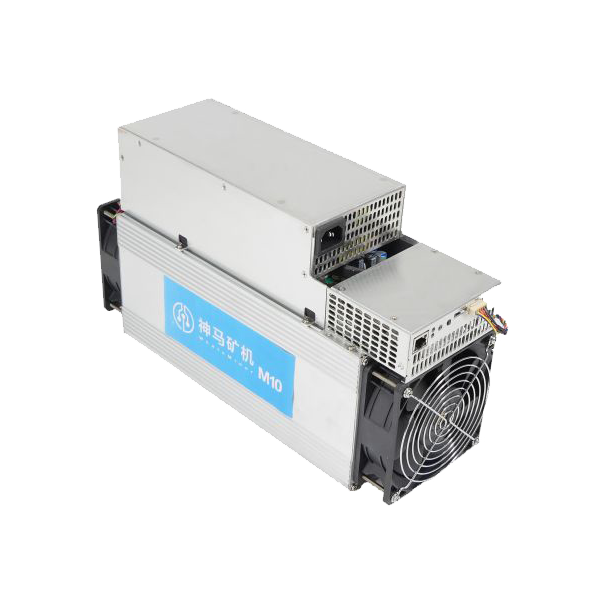
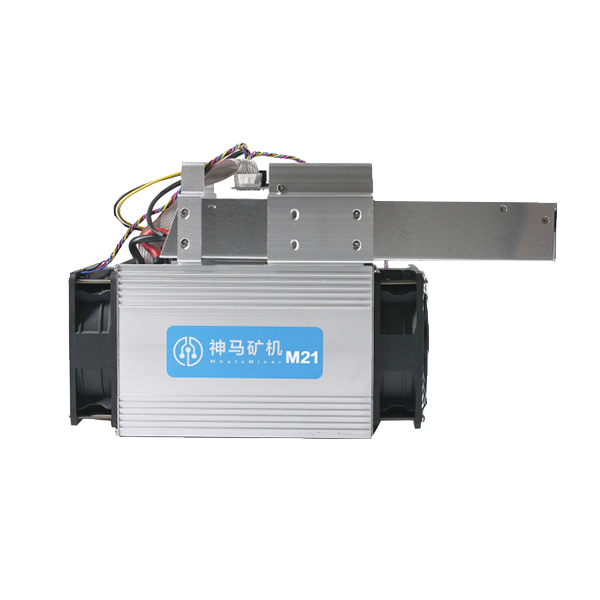
MicroBT Whatsminer M10 vs MicroBT Whatsminer M21
Side-by-side specs, profitability, and home mining comparison.
Specifications Comparison
| MicroBT Whatsminer M10 | Specification | MicroBT Whatsminer M21 |
|---|---|---|
| 33.0 TH/s | Hashrate | 31.0 TH/s |
| 2,145 W | Power Consumption | 1,860 W |
| 65.0 J/TH | Efficiency | 60.0 J/TH |
| — | Noise Level | — |
| 8,550.0 kg | Weight | 7,150.0 kg |
| 7,319 BTU/hr | BTU Output | 6,346 BTU/hr |
| 26/100 | Home Mining Score | 28/100 |
| — | Release Year | — |
| SHA-256 | Algorithm | SHA-256 |
| MicroBT | Manufacturer | MicroBT |
Profitability Comparison
MicroBT Whatsminer M10
MicroBT Whatsminer M21
Based on BTC price of $78,139 and current network difficulty as of May 16, 2026. Actual results vary.
Verdict
Run the numbers across every spec and the MicroBT Whatsminer M21 edges it: 3 of 4 factors go its way (efficiency, power consumption, home mining score). The standout gap is 13% better power draw (2,145 vs 1,860 W) in the MicroBT Whatsminer M21's favour. The MicroBT Whatsminer M10 holds the edge in hashrate. Review the detailed specs and profitability calculations above to determine which miner best fits your specific setup.
Spec Deltas
Stripped to the numbers, this is how far apart the MicroBT Whatsminer M10 and MicroBT Whatsminer M21 sit on each measurable spec:
- MicroBT Whatsminer M10 6% more hashrate (33.0 vs 31.0 TH/s)
- MicroBT Whatsminer M21 13% better power draw (2,145 vs 1,860 W)
- MicroBT Whatsminer M21 8% better efficiency (65.0 vs 60.0 J/TH)
- MicroBT Whatsminer M21 16% better weight (8,550 vs 7,150 kg)
- MicroBT Whatsminer M10 15% more heat output (7,319 vs 6,346 BTU/hr)
- MicroBT Whatsminer M21 8% more home mining score (26.0 vs 28.0)
Cost & ROI Over Time
Hardware cost is only half the story — here is how each miner's upfront price plays out against cumulative profit at a $0.10/kWh rate.
| MicroBT Whatsminer M10 | Metric | MicroBT Whatsminer M21 |
|---|---|---|
| $2,500 | Upfront cost (MSRP) | — |
| -$3.96 | Daily net profit | -$3.35 |
| -$3,946 | Net after 1 year | -$1,222 |
| -$5,392 | Net after 2 years | -$2,445 |
| -$6,838 | Net after 3 years | -$3,667 |
| Does not pay back at current rates (negative daily profit) | Payback period | — |
Projections assume continuous operation, a flat $0.10/kWh rate, and no hardware degradation, pool fees, or BTC price change. Real-world ROI varies.
Best For...
Best for Profitability
TieBoth miners produce similar daily profit.
Best for Home Mining
MicroBT Whatsminer M21Score: 28/100. 0 dB noise level.
Best for Efficiency
MicroBT Whatsminer M2160.0 J/TH — lower electricity cost per terahash.
Frequently Asked Questions
Is the MicroBT Whatsminer M10 or MicroBT Whatsminer M21 more profitable?
At the current BTC price and a $0.10/kWh electricity rate, the MicroBT Whatsminer M21 is more profitable at $-3.35/day compared to $-3.96/day for the MicroBT Whatsminer M10. Profitability depends heavily on your electricity rate — use the selector above to calculate with your actual costs.
MicroBT Whatsminer M10 vs MicroBT Whatsminer M21: which runs at a lower noise level?
Both miners have similar noise levels. Check the specs table above for exact decibel readings.
For mining at home, should I pick the MicroBT Whatsminer M10 or the MicroBT Whatsminer M21?
The MicroBT Whatsminer M21 scores 28/100 on our Home Mining Score (vs 26/100 for the MicroBT Whatsminer M10). This composite score factors in noise, power requirements, heat output, size, and setup ease — all critical for residential mining.
What is the efficiency difference between MicroBT Whatsminer M10 and MicroBT Whatsminer M21?
The MicroBT Whatsminer M10 runs at 65.0 J/TH while the MicroBT Whatsminer M21 runs at 60.0 J/TH — a difference of 5.0 J/TH. Lower efficiency means less electricity per terahash of mining power, directly reducing operating costs. In relative terms that is 8% better efficiency (65.0 vs 60.0 J/TH).