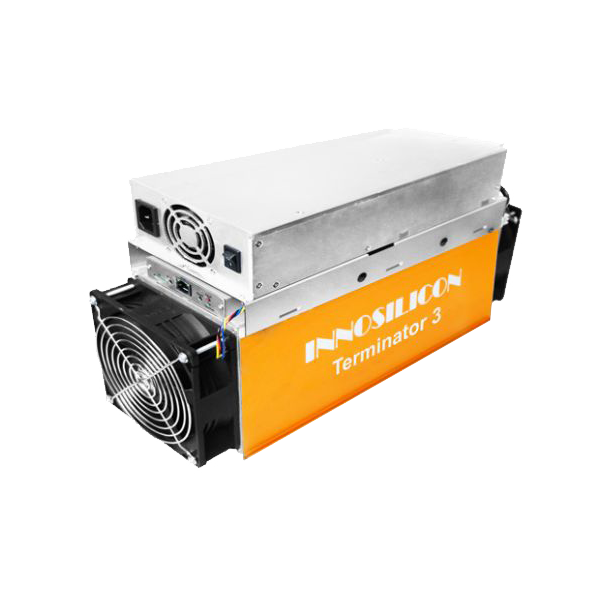
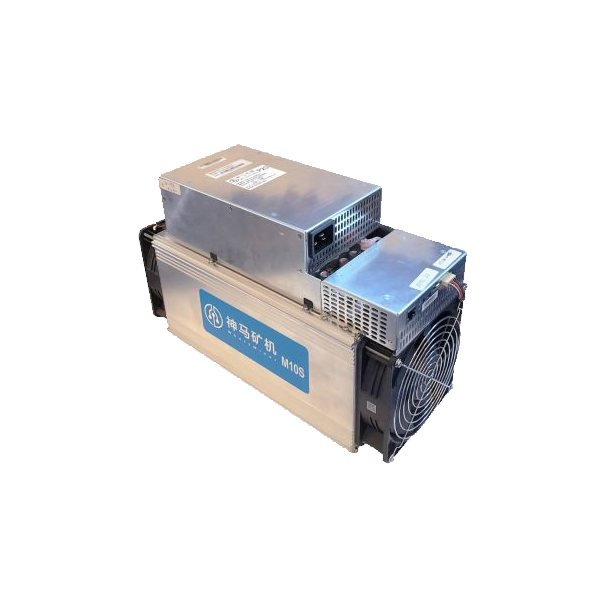
Innosilicon T3+ 52T vs MicroBT Whatsminer M10S
Side-by-side specs, profitability, and home mining comparison.
Specifications Comparison
| Innosilicon T3+ 52T | Specification | MicroBT Whatsminer M10S |
|---|---|---|
| 52.0 TH/s | Hashrate | 55.0 TH/s |
| 2,800 W | Power Consumption | 3,500 W |
| 53.9 J/TH | Efficiency | 63.6 J/TH |
| — | Noise Level | — |
| 10,000.0 kg | Weight | 10,700.0 kg |
| 9,554 BTU/hr | BTU Output | 11,942 BTU/hr |
| 22/100 | Home Mining Score | 22/100 |
| — | Release Year | — |
| SHA-256 | Algorithm | SHA-256 |
| Innosilicon | Manufacturer | MicroBT |
Profitability Comparison
Innosilicon T3+ 52T
MicroBT Whatsminer M10S
Based on BTC price of $79,240 and current network difficulty as of May 15, 2026. Actual results vary.
Verdict
Our scoring model gives the nod to the Innosilicon T3+ 52T, which leads on 2 of 3 weighted factors (efficiency, power consumption). Its biggest concrete edge: 20% better power draw (2,800 vs 3,500 W). The MicroBT Whatsminer M10S claws back ground on hashrate. The right pick still depends on your power cost and noise tolerance — the breakdowns above make that call concrete.
Spec Deltas
The Innosilicon T3+ 52T and MicroBT Whatsminer M10S diverge on the metrics below — each gap expressed as a real percentage, not a vague "better":
- MicroBT Whatsminer M10S 6% more hashrate (52.0 vs 55.0 TH/s)
- Innosilicon T3+ 52T 20% better power draw (2,800 vs 3,500 W)
- Innosilicon T3+ 52T 15% better efficiency (53.9 vs 63.6 J/TH)
- Innosilicon T3+ 52T 7% better weight (10,000 vs 10,700 kg)
- MicroBT Whatsminer M10S 25% more heat output (9,554 vs 11,942 BTU/hr)
Cost & ROI Over Time
Hardware cost is only half the story — here is how each miner's upfront price plays out against cumulative profit at a $0.10/kWh rate.
| Innosilicon T3+ 52T | Metric | MicroBT Whatsminer M10S |
|---|---|---|
| — | Upfront cost (MSRP) | $3,800 |
| -$4.76 | Daily net profit | -$6.33 |
| -$1,739 | Net after 1 year | -$6,111 |
| -$3,478 | Net after 2 years | -$8,422 |
| -$5,217 | Net after 3 years | -$10,733 |
| — | Payback period | Does not pay back at current rates (negative daily profit) |
Projections assume continuous operation, a flat $0.10/kWh rate, and no hardware degradation, pool fees, or BTC price change. Real-world ROI varies.
Best For...
Best for Profitability
TieBoth miners produce similar daily profit.
Best for Home Mining
TieBoth miners are equally suitable for home use.
Best for Efficiency
Innosilicon T3+ 52T53.9 J/TH — lower electricity cost per terahash.
Frequently Asked Questions
Innosilicon T3+ 52T vs MicroBT Whatsminer M10S: which one earns more per day?
At the current BTC price and a $0.10/kWh electricity rate, the Innosilicon T3+ 52T is more profitable at $-4.76/day compared to $-6.33/day for the MicroBT Whatsminer M10S. Profitability depends heavily on your electricity rate — use the selector above to calculate with your actual costs.
Innosilicon T3+ 52T vs MicroBT Whatsminer M10S: which runs at a lower noise level?
Both miners have similar noise levels. Check the specs table above for exact decibel readings.
Which is better for home mining, the Innosilicon T3+ 52T or MicroBT Whatsminer M10S?
Both miners score similarly on our Home Mining Score. Consider your specific constraints (noise tolerance, available power, heat needs) to decide.
How far apart are the Innosilicon T3+ 52T and MicroBT Whatsminer M10S on J/TH?
The Innosilicon T3+ 52T runs at 53.9 J/TH while the MicroBT Whatsminer M10S runs at 63.6 J/TH — a difference of 9.8 J/TH. Lower efficiency means less electricity per terahash of mining power, directly reducing operating costs. In relative terms that is 15% better efficiency (53.9 vs 63.6 J/TH).
Compare Innosilicon T3+ 52T with...
- Innosilicon T3+ 52T vs Innosilicon A10 ETHMaster (500Mh)
- Innosilicon T3+ 52T vs Innosilicon A10 Pro ETH (500Mh)
- Innosilicon T3+ 52T vs Innosilicon A10 Pro+ ETH (750Mh)
- Innosilicon T3+ 52T vs Innosilicon A11 Pro
- Innosilicon T3+ 52T vs Innosilicon A11 Pro ETH (1500Mh)
- Innosilicon T3+ 52T vs Innosilicon A4 Dominator