
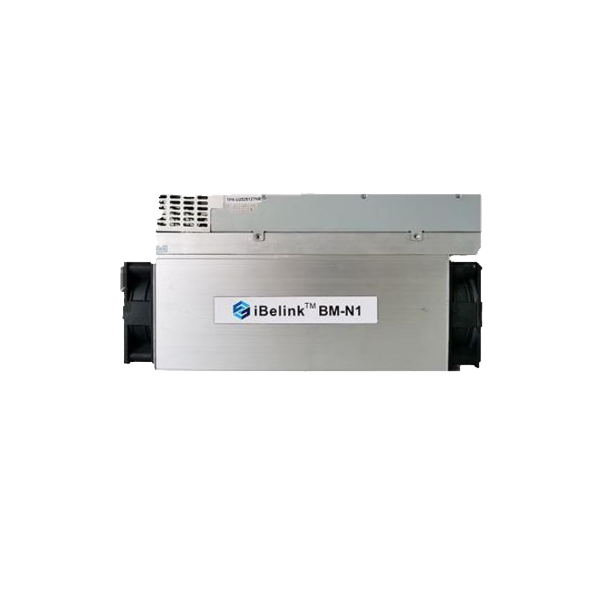
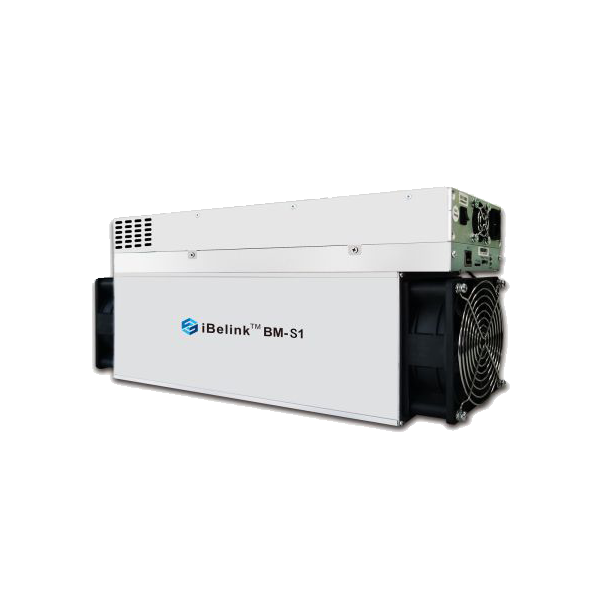
iBeLink BM-N1 vs iBeLink BM-S1
Side-by-side specs, profitability, and home mining comparison.
Specifications Comparison
| iBeLink BM-N1 | Specification | iBeLink BM-S1 |
|---|---|---|
| 6.6 TH/s | Taux de hachage | 6.8 TH/s |
| 2,400 W | Consommation électrique | 2,350 W |
| 363.6 J/TH | Efficiency | 345.6 J/TH |
| — | Niveau de bruit | — |
| 9.9 kg | Weight | 9.0 kg |
| 8,189 BTU/hr | BTU Output | 8,018 BTU/hr |
| 26/100 | Home Mining Score | 26/100 |
| — | Release Year | — |
| Eaglesong | Algorithme | Blake2b-sia |
| iBeLink | Manufacturer | iBeLink |
Profitability Comparison
iBeLink BM-N1
iBeLink BM-S1
Based on BTC price of $73,410 and current network difficulty as of May 30, 2026. Actual results vary.
Verdict
Run the numbers across every spec and the iBeLink BM-S1 edges it: 3 of 3 factors go its way (efficacité, hashrate, consommation électrique). Its biggest concrete edge: 5% better efficacité (364 vs 346 J/TH). Review the detailed specs and profitability calculations above to determine which miner best fits your specific setup.
Spec Deltas
Here is every spec where the iBeLink BM-N1 and iBeLink BM-S1 actually differ, with the gap quantified:
- iBeLink BM-S1 3% more hashrate (6.6 vs 6.8 TH/s)
- iBeLink BM-S1 2% better power draw (2,400 vs 2,350 W)
- iBeLink BM-S1 5% better efficacité (364 vs 346 J/TH)
- iBeLink BM-S1 9% better weight (9.9 vs 9.0 kg)
- iBeLink BM-N1 2% more heat output (8,189 vs 8,018 BTU/hr)
Cost & ROI Over Time
A miner pays for itself in profit, not specs. These projections track upfront cost against one, two and three years of net earnings at $0.10/kWh.
| iBeLink BM-N1 | Metric | iBeLink BM-S1 |
|---|---|---|
| — | Upfront cost (MSRP) | $768 |
| -$5.54 | Daily net profit | -$5.41 |
| -$2,022 | Net after 1 year | -$2,744 |
| -$4,045 | Net after 2 years | -$4,720 |
| -$6,067 | Net after 3 years | -$6,697 |
| — | Payback period | Does not pay back at current rates (negative daily profit) |
Projections assume continuous operation, a flat $0.10/kWh rate, and no hardware degradation, pool fees, or BTC price change. Real-world ROI varies.
Best For...
Best for Profitability
TieBoth miners produce similar daily profit.
Best for Home Mining
TieBoth miners are equally suitable for home use.
Best for Efficiency
iBeLink BM-S1345.6 J/TH — lower electricity cost per terahash.
Frequently Asked Questions
Which makes more money, the iBeLink BM-N1 or the iBeLink BM-S1?
At the current BTC price and a $0.10/kWh electricity rate, the iBeLink BM-S1 is more profitable at $-5.41/day compared to $-5.54/day for the iBeLink BM-N1. Profitability depends heavily on your electricity rate — use the selector above to calculate with your actual costs.
Which is quieter, the iBeLink BM-N1 or iBeLink BM-S1?
Both miners have similar noise levels. Check the specs table above for exact decibel readings.
iBeLink BM-N1 vs iBeLink BM-S1: which fits a residential setup better?
Both miners score similarly on our Home Mining Score. Consider your specific constraints (noise tolerance, available power, heat needs) to decide.
iBeLink BM-N1 vs iBeLink BM-S1: how much does the efficiency gap matter?
The iBeLink BM-N1 runs at 363.6 J/TH while the iBeLink BM-S1 runs at 345.6 J/TH — a difference of 18.1 J/TH. Lower efficiency means less electricity per terahash of mining power, directly reducing operating costs. In relative terms that is 5% better efficacité (364 vs 346 J/TH).