Ebang Ebit E11++ vs Nerdminer
Side-by-side specs, profitability, and home mining comparison.
Specifications Comparison
| Ebang Ebit E11++ | Specification | Nerdminer |
|---|---|---|
| 44.0 TH/s | Taux de hachage | 50.0 KH/s |
| 1,980 W | Consommation électrique | 1 W |
| 45.0 J/TH | Efficiency | 20,000,000.0 J/TH |
| — | Niveau de bruit | — |
| — | Weight | 0.1 kg |
| 6,756 BTU/hr | BTU Output | 3 BTU/hr |
| 28/100 | Home Mining Score | 35/100 |
| — | Release Year | — |
| SHA-256 | Algorithme | SHA-256 |
| Ebang | Manufacturer | D-Central |
Profitability Comparison
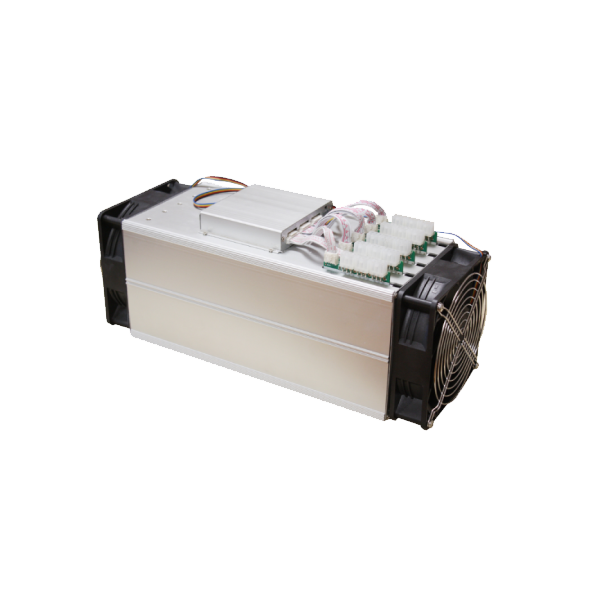
Ebang Ebit E11++
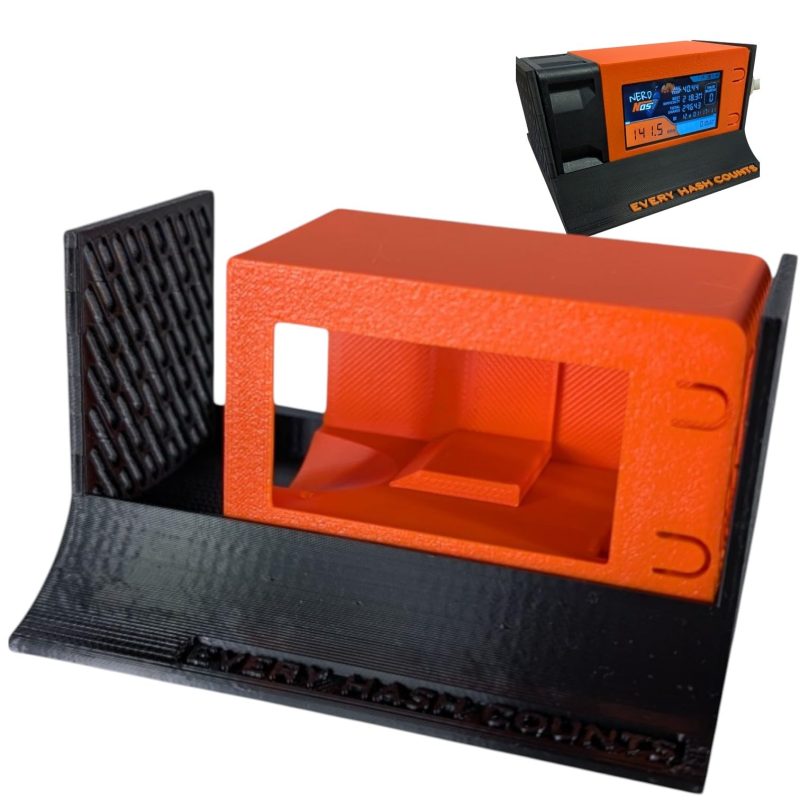
Nerdminer
Based on BTC price of $64,000 and current network difficulty as of Jun 4, 2026. Actual results vary.
Verdict
Selon notre analyse multifactorielle, le Ebang Ebit E11++ l'emporte sur 2 des 4 facteurs (efficacité, hashrate). The standout gap is 87999999900% more hashrate (44.0 vs 0.0 TH/s) in the Ebang Ebit E11++'s favour. The Nerdminer holds the edge in consommation électrique and score de minage domestique. Review the detailed specs and profitability calculations above to determine which miner best fits your specific setup.
Spec Deltas
Here is every spec where the Ebang Ebit E11++ and Nerdminer actually differ, with the gap quantified:
- Ebang Ebit E11++ 87999999900% more hashrate (44.0 vs 0.0 TH/s)
- Nerdminer 100% better power draw (1,980.0 vs 1.0 W)
- Ebang Ebit E11++ 100% better efficacité (45.0 vs 20,000,000.0 J/TH)
- Ebang Ebit E11++ 198600% more heat output (6,755.8 vs 3.4 BTU/hr)
- Nerdminer 25% more score de minage domestique (28.0 vs 35.0)
Cost & ROI Over Time
Hardware cost is only half the story — here is how each miner's upfront price plays out against cumulative profit at a $0.10/kWh rate.
| Ebang Ebit E11++ | Metric | Nerdminer |
|---|---|---|
| — | Upfront cost (MSRP) | $29 |
| -$3.48 | Daily net profit | -$0.00 |
| -$1,269 | Net after 1 year | -$30 |
| -$2,539 | Net after 2 years | -$31 |
| -$3,808 | Net after 3 years | -$32 |
| — | Payback period | Does not pay back at current rates (negative daily profit) |
Projections assume continuous operation, a flat $0.10/kWh rate, and no hardware degradation, pool fees, or BTC price change. Real-world ROI varies.
Best For...
Best for Profitability
TieBoth miners produce similar daily profit.
Best for Home Mining
NerdminerScore: 35/100. 0 dB noise level.
Best for Efficiency
Ebang Ebit E11++45.0 J/TH — lower electricity cost per terahash.
Frequently Asked Questions
Which makes more money, the Ebang Ebit E11++ or the Nerdminer?
At the current BTC price and a $0.10/kWh electricity rate, the Nerdminer is more profitable at $0.00/day compared to $-3.48/day for the Ebang Ebit E11++. Profitability depends heavily on your electricity rate — use the selector above to calculate with your actual costs.
Is the Ebang Ebit E11++ or the Nerdminer better for noise-sensitive spaces?
Both miners have similar noise levels. Check the specs table above for exact decibel readings.
Ebang Ebit E11++ vs Nerdminer: which fits a residential setup better?
The Nerdminer scores 35/100 on our Home Mining Score (vs 28/100 for the Ebang Ebit E11++). This composite score factors in noise, power requirements, heat output, size, and setup ease — all critical for residential mining.
Ebang Ebit E11++ vs Nerdminer: how much does the efficiency gap matter?
The Ebang Ebit E11++ runs at 45.0 J/TH while the Nerdminer runs at 20,000,000.0 J/TH — a difference of 19,999,955.0 J/TH. Lower efficiency means less electricity per terahash of mining power, directly reducing operating costs. In relative terms that is 100% better efficacité (45.0 vs 20,000,000.0 J/TH).