

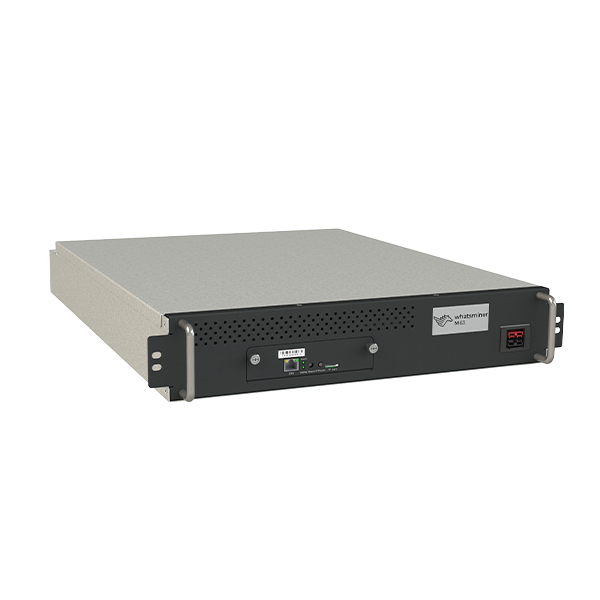
Ebang Ebit E12+ vs Whatsminer M63
Side-by-side specs, profitability, and home mining comparison.
Specifications Comparison
| Ebang Ebit E12+ | Specification | Whatsminer M63 |
|---|---|---|
| 50.0 TH/s | Taux de hachage | 360.0 TH/s |
| 2,500 W | Consommation électrique | 7,200 W |
| 50.0 J/TH | Efficiency | 20.0 J/TH |
| — | Niveau de bruit | 50 dB |
| 10.5 kg | Weight | 27.5 kg |
| 8,530 BTU/hr | BTU Output | 24,566 BTU/hr |
| 26/100 | Home Mining Score | 44/100 |
| — | Release Year | — |
| SHA-256 | Algorithme | SHA-256 |
| Ebang | Manufacturer | MicroBT |
Profitability Comparison
Ebang Ebit E12+
Whatsminer M63
Based on BTC price of $73,647 and current network difficulty as of May 30, 2026. Actual results vary.
Verdict
Selon notre analyse multifactorielle, le Whatsminer M63 l'emporte sur 4 des 5 facteurs (efficacité, hashrate, score de minage domestique, niveau sonore). The standout gap is 620% more hashrate (50.0 vs 360.0 TH/s) in the Whatsminer M63's favour. The Ebang Ebit E12+ claws back ground on consommation électrique. Cross-check the spec deltas and operating-cost table above against your own electricity rate before deciding.
Spec Deltas
Stripped to the numbers, this is how far apart the Ebang Ebit E12+ and Whatsminer M63 sit on each measurable spec:
- Whatsminer M63 620% more hashrate (50.0 vs 360.0 TH/s)
- Ebang Ebit E12+ 65% better power draw (2,500 vs 7,200 W)
- Whatsminer M63 60% better efficacité (50.0 vs 20.0 J/TH)
- Ebang Ebit E12+ 62% better weight (10.5 vs 27.5 kg)
- Whatsminer M63 188% more heat output (8,530 vs 24,566 BTU/hr)
- Whatsminer M63 69% more score de minage domestique (26.0 vs 44.0)
Cost & ROI Over Time
A miner pays for itself in profit, not specs. These projections track upfront cost against one, two and three years of net earnings at $0.10/kWh.
| Ebang Ebit E12+ | Metric | Whatsminer M63 |
|---|---|---|
| — | Upfront cost (MSRP) | $11,000 |
| -$4.33 | Daily net profit | -$5.29 |
| -$1,582 | Net after 1 year | -$12,929 |
| -$3,164 | Net after 2 years | -$14,858 |
| -$4,746 | Net after 3 years | -$16,788 |
| — | Payback period | Does not pay back at current rates (negative daily profit) |
Projections assume continuous operation, a flat $0.10/kWh rate, and no hardware degradation, pool fees, or BTC price change. Real-world ROI varies.
Best For...
Best for Profitability
TieBoth miners produce similar daily profit.
Best for Home Mining
Whatsminer M63Score: 44/100. 50 dB noise level.
Best for Efficiency
Whatsminer M6320.0 J/TH — lower electricity cost per terahash.
Frequently Asked Questions
Ebang Ebit E12+ vs Whatsminer M63: which one earns more per day?
At the current BTC price and a $0.10/kWh electricity rate, the Ebang Ebit E12+ is more profitable at $-4.33/day compared to $-5.29/day for the Whatsminer M63. Profitability depends heavily on your electricity rate — use the selector above to calculate with your actual costs.
Is the Ebang Ebit E12+ or the Whatsminer M63 better for noise-sensitive spaces?
The Whatsminer M63 is quieter at 50 dB compared to the Ebang Ebit E12+ at 0 dB. For home mining, lower noise levels make a significant difference in livability.
For mining at home, should I pick the Ebang Ebit E12+ or the Whatsminer M63?
The Whatsminer M63 scores 44/100 on our Home Mining Score (vs 26/100 for the Ebang Ebit E12+). This composite score factors in noise, power requirements, heat output, size, and setup ease — all critical for residential mining.
Ebang Ebit E12+ vs Whatsminer M63: how much does the efficiency gap matter?
The Ebang Ebit E12+ runs at 50.0 J/TH while the Whatsminer M63 runs at 20.0 J/TH — a difference of 30.0 J/TH. Lower efficiency means less electricity per terahash of mining power, directly reducing operating costs. In relative terms that is 60% better efficacité (50.0 vs 20.0 J/TH).