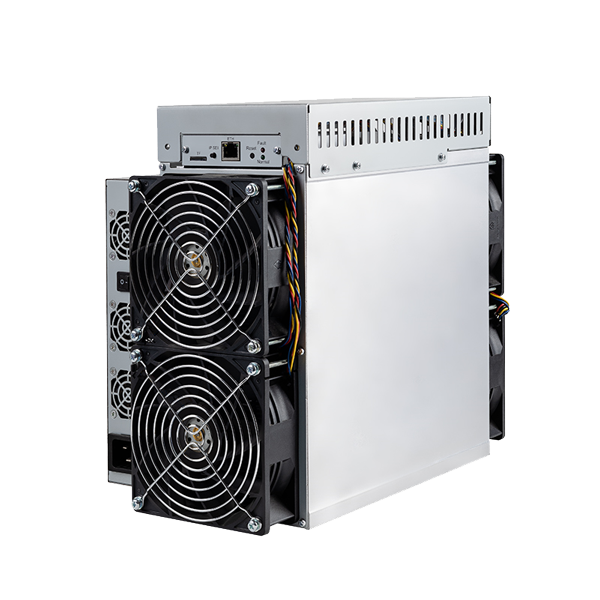
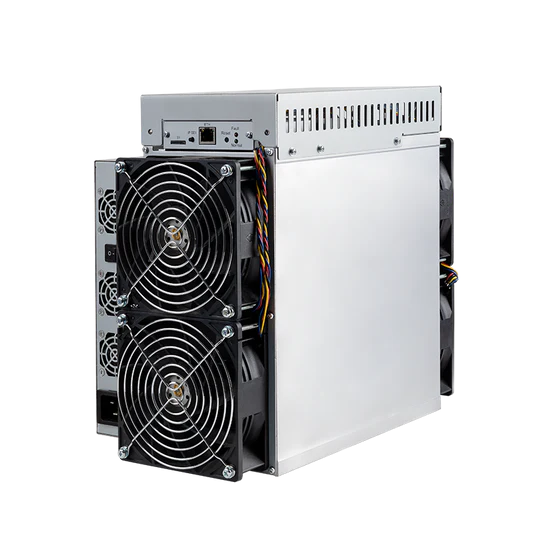
iBeLink BM-N3 vs iBeLink BM-N3 Max
Side-by-side specs, profitability, and home mining comparison.
Specifications Comparison
| iBeLink BM-N3 | Specification | iBeLink BM-N3 Max |
|---|---|---|
| 25.0 TH/s | Hashrate | 30.0 TH/s |
| 3,300 W | Power Consumption | 3,300 W |
| 132.0 J/TH | Efficiency | 110.0 J/TH |
| — | Noise Level | 75 dB |
| — | Weight | 6.6 kg |
| 11,260 BTU/hr | BTU Output | 11,260 BTU/hr |
| 22/100 | Home Mining Score | 36/100 |
| — | Release Year | — |
| Eaglesong | Algorithm | Eaglesong |
| iBeLink | Manufacturer | iBeLink |
Profitability Comparison
iBeLink BM-N3
iBeLink BM-N3 Max
Based on BTC price of $78,153 and current network difficulty as of May 16, 2026. Actual results vary.
Verdict
Our scoring model gives the nod to the iBeLink BM-N3 Max, which leads on 4 of 4 weighted factors (efficiency, hashrate, home mining score, noise level). Its biggest concrete edge: 17% better efficiency (132 vs 110 J/TH). The right pick still depends on your power cost and noise tolerance — the breakdowns above make that call concrete.
Spec Deltas
Here is every spec where the iBeLink BM-N3 and iBeLink BM-N3 Max actually differ, with the gap quantified:
- iBeLink BM-N3 Max 20% more hashrate (25.0 vs 30.0 TH/s)
- iBeLink BM-N3 Max 17% better efficiency (132 vs 110 J/TH)
- iBeLink BM-N3 Max 64% more home mining score (22.0 vs 36.0)
Cost & ROI Over Time
Hardware cost is only half the story — here is how each miner's upfront price plays out against cumulative profit at a $0.10/kWh rate.
| iBeLink BM-N3 | Metric | iBeLink BM-N3 Max |
|---|---|---|
| $980 | Upfront cost (MSRP) | — |
| -$7.02 | Daily net profit | -$6.84 |
| -$3,543 | Net after 1 year | -$2,497 |
| -$6,105 | Net after 2 years | -$4,994 |
| -$8,668 | Net after 3 years | -$7,491 |
| Does not pay back at current rates (negative daily profit) | Payback period | — |
Projections assume continuous operation, a flat $0.10/kWh rate, and no hardware degradation, pool fees, or BTC price change. Real-world ROI varies.
Best For...
Best for Profitability
TieBoth miners produce similar daily profit.
Best for Home Mining
iBeLink BM-N3 MaxScore: 36/100. 75 dB noise level.
Best for Efficiency
iBeLink BM-N3 Max110.0 J/TH — lower electricity cost per terahash.
Frequently Asked Questions
iBeLink BM-N3 vs iBeLink BM-N3 Max: which one earns more per day?
At the current BTC price and a $0.10/kWh electricity rate, the iBeLink BM-N3 Max is more profitable at $-6.84/day compared to $-7.02/day for the iBeLink BM-N3. Profitability depends heavily on your electricity rate — use the selector above to calculate with your actual costs.
Is the iBeLink BM-N3 or the iBeLink BM-N3 Max better for noise-sensitive spaces?
The iBeLink BM-N3 Max is quieter at 75 dB compared to the iBeLink BM-N3 at 0 dB. For home mining, lower noise levels make a significant difference in livability.
iBeLink BM-N3 vs iBeLink BM-N3 Max: which fits a residential setup better?
The iBeLink BM-N3 Max scores 36/100 on our Home Mining Score (vs 22/100 for the iBeLink BM-N3). This composite score factors in noise, power requirements, heat output, size, and setup ease — all critical for residential mining.
How far apart are the iBeLink BM-N3 and iBeLink BM-N3 Max on J/TH?
The iBeLink BM-N3 runs at 132.0 J/TH while the iBeLink BM-N3 Max runs at 110.0 J/TH — a difference of 22.0 J/TH. Lower efficiency means less electricity per terahash of mining power, directly reducing operating costs. In relative terms that is 17% better efficiency (132 vs 110 J/TH).