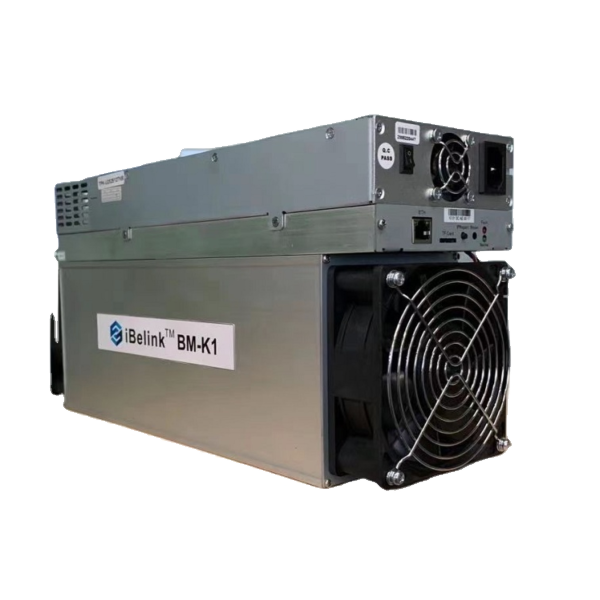
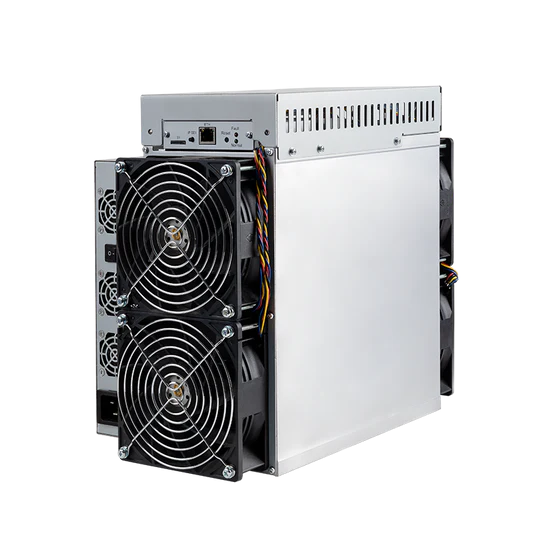
iBeLink BM-K1 vs iBeLink BM-N3 Max
Side-by-side specs, profitability, and home mining comparison.
Specifications Comparison
| iBeLink BM-K1 | Specification | iBeLink BM-N3 Max |
|---|---|---|
| 5.3 TH/s | Hashrate | 30.0 TH/s |
| 835 W | Power Consumption | 3,300 W |
| 157.6 J/TH | Efficiency | 110.0 J/TH |
| — | Noise Level | 75 dB |
| 6,600.0 kg | Weight | 6.6 kg |
| 2,849 BTU/hr | BTU Output | 11,260 BTU/hr |
| 28/100 | Home Mining Score | 36/100 |
| — | Release Year | — |
| Blake2s | Algorithm | Eaglesong |
| iBeLink | Manufacturer | iBeLink |
Profitability Comparison
iBeLink BM-K1
iBeLink BM-N3 Max
Based on BTC price of $78,153 and current network difficulty as of May 16, 2026. Actual results vary.
Verdict
Based on our multi-factor analysis, the iBeLink BM-N3 Max wins on 4 of 5 factors (efficiency, hashrate, home mining score, noise level). Where it pulls away hardest is 466% more hashrate (5.3 vs 30.0 TH/s). The iBeLink BM-K1 holds the edge in power consumption. The right pick still depends on your power cost and noise tolerance — the breakdowns above make that call concrete.
Spec Deltas
Here is every spec where the iBeLink BM-K1 and iBeLink BM-N3 Max actually differ, with the gap quantified:
- iBeLink BM-N3 Max 466% more hashrate (5.3 vs 30.0 TH/s)
- iBeLink BM-K1 75% better power draw (835 vs 3,300 W)
- iBeLink BM-N3 Max 30% better efficiency (158 vs 110 J/TH)
- iBeLink BM-N3 Max 100% better weight (6,600.0 vs 6.6 kg)
- iBeLink BM-N3 Max 295% more heat output (2,849 vs 11,260 BTU/hr)
- iBeLink BM-N3 Max 29% more home mining score (28.0 vs 36.0)
Cost & ROI Over Time
Sticker price versus what the miner actually earns back: the table below projects cumulative net profit at a $0.10/kWh electricity rate.
| iBeLink BM-K1 | Metric | iBeLink BM-N3 Max |
|---|---|---|
| $9,855 | Upfront cost (MSRP) | — |
| -$1.81 | Daily net profit | -$6.84 |
| -$10,517 | Net after 1 year | -$2,497 |
| -$11,179 | Net after 2 years | -$4,994 |
| -$11,841 | Net after 3 years | -$7,491 |
| Does not pay back at current rates (negative daily profit) | Payback period | — |
Projections assume continuous operation, a flat $0.10/kWh rate, and no hardware degradation, pool fees, or BTC price change. Real-world ROI varies.
Best For...
Best for Profitability
TieBoth miners produce similar daily profit.
Best for Home Mining
iBeLink BM-N3 MaxScore: 36/100. 75 dB noise level.
Best for Efficiency
iBeLink BM-N3 Max110.0 J/TH — lower electricity cost per terahash.
Frequently Asked Questions
Which makes more money, the iBeLink BM-K1 or the iBeLink BM-N3 Max?
At the current BTC price and a $0.10/kWh electricity rate, the iBeLink BM-K1 is more profitable at $-1.81/day compared to $-6.84/day for the iBeLink BM-N3 Max. Profitability depends heavily on your electricity rate — use the selector above to calculate with your actual costs.
Is the iBeLink BM-K1 or the iBeLink BM-N3 Max better for noise-sensitive spaces?
The iBeLink BM-N3 Max is quieter at 75 dB compared to the iBeLink BM-K1 at 0 dB. For home mining, lower noise levels make a significant difference in livability.
For mining at home, should I pick the iBeLink BM-K1 or the iBeLink BM-N3 Max?
The iBeLink BM-N3 Max scores 36/100 on our Home Mining Score (vs 28/100 for the iBeLink BM-K1). This composite score factors in noise, power requirements, heat output, size, and setup ease — all critical for residential mining.
What is the efficiency difference between iBeLink BM-K1 and iBeLink BM-N3 Max?
The iBeLink BM-K1 runs at 157.6 J/TH while the iBeLink BM-N3 Max runs at 110.0 J/TH — a difference of 47.6 J/TH. Lower efficiency means less electricity per terahash of mining power, directly reducing operating costs. In relative terms that is 30% better efficiency (158 vs 110 J/TH).