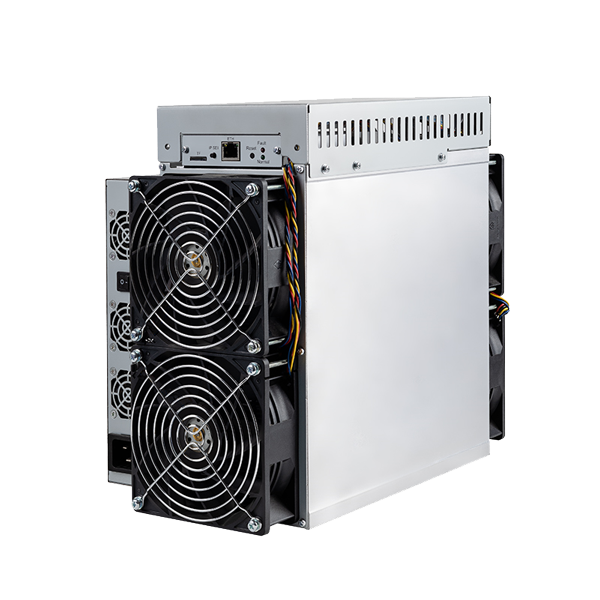
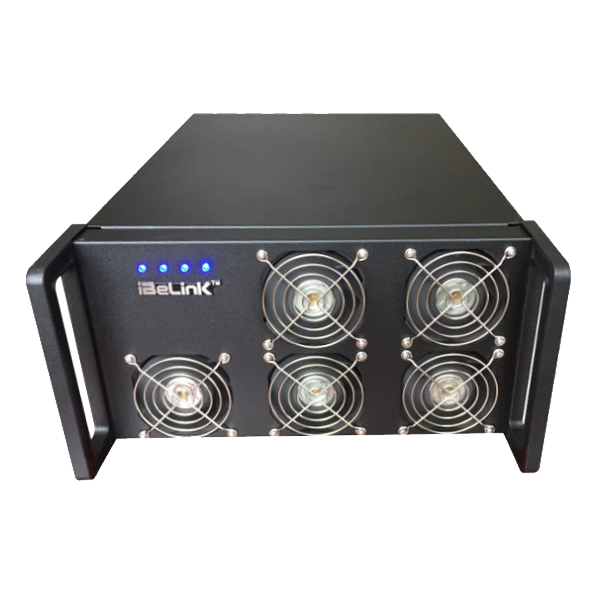
iBeLink BM-N3 vs iBeLink DM11G
Side-by-side specs, profitability, and home mining comparison.
Specifications Comparison
| iBeLink BM-N3 | Specification | iBeLink DM11G |
|---|---|---|
| 25.0 TH/s | Hashrate | 10.8 GH/s |
| 3,300 W | Power Consumption | 810 W |
| 132.0 J/TH | Efficiency | 75,000.0 J/TH |
| — | Noise Level | — |
| — | Weight | 19,000.0 kg |
| 11,260 BTU/hr | BTU Output | 2,764 BTU/hr |
| 22/100 | Home Mining Score | 28/100 |
| — | Release Year | — |
| Eaglesong | Algorithm | X11 |
| iBeLink | Manufacturer | iBeLink |
Profitability Comparison
iBeLink BM-N3
iBeLink DM11G
Based on BTC price of $78,153 and current network difficulty as of May 16, 2026. Actual results vary.
Verdict
Based on our multi-factor analysis, the iBeLink BM-N3 wins on 2 of 4 factors (efficiency, hashrate). Where it pulls away hardest is 231381% more hashrate (25.0 vs 0.0 TH/s). The iBeLink DM11G holds the edge in power consumption and home mining score. Cross-check the spec deltas and ROI table above against your own electricity rate before deciding.
Spec Deltas
Stripped to the numbers, this is how far apart the iBeLink BM-N3 and iBeLink DM11G sit on each measurable spec:
- iBeLink BM-N3 231381% more hashrate (25.0 vs 0.0 TH/s)
- iBeLink DM11G 75% better power draw (3,300 vs 810 W)
- iBeLink BM-N3 100% better efficiency (132 vs 75,000 J/TH)
- iBeLink BM-N3 307% more heat output (11,260 vs 2,764 BTU/hr)
- iBeLink DM11G 27% more home mining score (22.0 vs 28.0)
Cost & ROI Over Time
A miner pays for itself in profit, not specs. These projections track upfront cost against one, two and three years of net earnings at $0.10/kWh.
| iBeLink BM-N3 | Metric | iBeLink DM11G |
|---|---|---|
| $980 | Upfront cost (MSRP) | — |
| -$7.02 | Daily net profit | -$1.94 |
| -$3,543 | Net after 1 year | -$709 |
| -$6,105 | Net after 2 years | -$1,419 |
| -$8,668 | Net after 3 years | -$2,128 |
| Does not pay back at current rates (negative daily profit) | Payback period | — |
Projections assume continuous operation, a flat $0.10/kWh rate, and no hardware degradation, pool fees, or BTC price change. Real-world ROI varies.
Best For...
Best for Profitability
TieBoth miners produce similar daily profit.
Best for Home Mining
iBeLink DM11GScore: 28/100. 0 dB noise level.
Best for Efficiency
iBeLink BM-N3132.0 J/TH — lower electricity cost per terahash.
Frequently Asked Questions
Is the iBeLink BM-N3 or iBeLink DM11G more profitable?
At the current BTC price and a $0.10/kWh electricity rate, the iBeLink DM11G is more profitable at $-1.94/day compared to $-7.02/day for the iBeLink BM-N3. Profitability depends heavily on your electricity rate — use the selector above to calculate with your actual costs.
Is the iBeLink BM-N3 or the iBeLink DM11G better for noise-sensitive spaces?
Both miners have similar noise levels. Check the specs table above for exact decibel readings.
For mining at home, should I pick the iBeLink BM-N3 or the iBeLink DM11G?
The iBeLink DM11G scores 28/100 on our Home Mining Score (vs 22/100 for the iBeLink BM-N3). This composite score factors in noise, power requirements, heat output, size, and setup ease — all critical for residential mining.
How far apart are the iBeLink BM-N3 and iBeLink DM11G on J/TH?
The iBeLink BM-N3 runs at 132.0 J/TH while the iBeLink DM11G runs at 75,000.0 J/TH — a difference of 74,868.0 J/TH. Lower efficiency means less electricity per terahash of mining power, directly reducing operating costs. In relative terms that is 100% better efficiency (132 vs 75,000 J/TH).