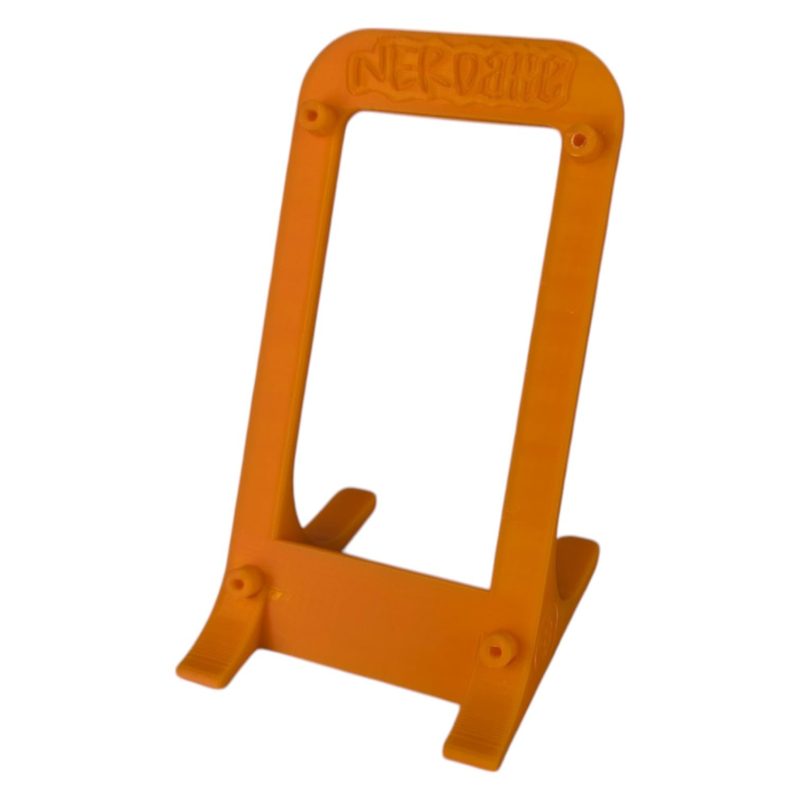
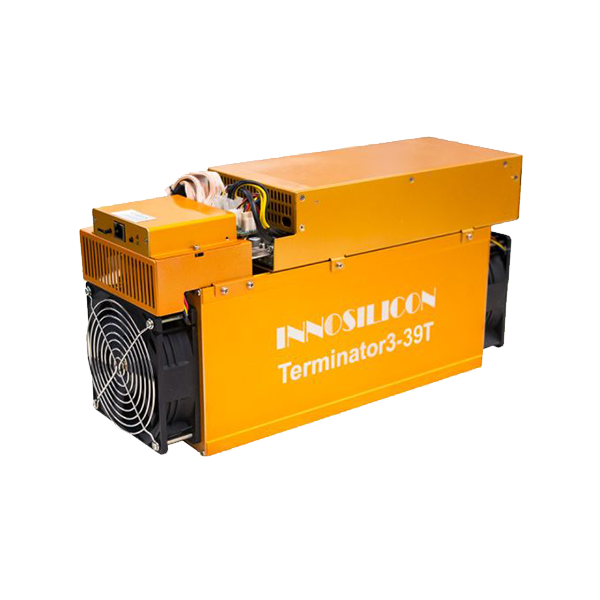
NerdAxe vs Innosilicon T3 39T
Side-by-side specs, profitability, and home mining comparison.
Specifications Comparison
| NerdAxe | Specification | Innosilicon T3 39T |
|---|---|---|
| 500.0 GH/s | Taux de hachage | 39.0 TH/s |
| 12 W | Consommation électrique | 2,150 W |
| 24.0 J/TH | Efficiency | 55.1 J/TH |
| 30 dB | Niveau de bruit | — |
| 0.2 kg | Weight | 8.7 kg |
| 41 BTU/hr | BTU Output | 7,336 BTU/hr |
| 70/100 | Home Mining Score | 26/100 |
| — | Release Year | — |
| SHA-256 | Algorithme | SHA-256 |
| D-Central | Manufacturer | Innosilicon |
Profitability Comparison
NerdAxe
Innosilicon T3 39T
Based on BTC price of $62,822 and current network difficulty as of Jun 4, 2026. Actual results vary.
Verdict
Selon notre analyse multifactorielle, le NerdAxe l'emporte sur 4 des 5 facteurs (efficacité, consommation électrique, score de minage domestique, niveau sonore). Its biggest concrete edge: 99% better power draw (12.0 vs 2,150.0 W). That said, the Innosilicon T3 39T isn't beaten everywhere — it still wins hashrate. The right pick still depends on your power cost and noise tolerance — the breakdowns above make that call concrete.
Spec Deltas
Here is every spec where the NerdAxe and Innosilicon T3 39T actually differ, with the gap quantified:
- Innosilicon T3 39T 7700% more hashrate (0.5 vs 39.0 TH/s)
- NerdAxe 99% better power draw (12.0 vs 2,150.0 W)
- NerdAxe 56% better efficacité (24.0 vs 55.1 J/TH)
- NerdAxe 98% better weight (0.2 vs 8.7 kg)
- Innosilicon T3 39T 17836% more heat output (40.9 vs 7,335.8 BTU/hr)
- NerdAxe 169% more score de minage domestique (70.0 vs 26.0)
Cost & ROI Over Time
Sticker price versus what the miner actually earns back: the table below projects cumulative net profit at a $0.10/kWh electricity rate.
| NerdAxe | Metric | Innosilicon T3 39T |
|---|---|---|
| $69 | Upfront cost (MSRP) | — |
| -$0.01 | Daily net profit | -$4.05 |
| -$74 | Net after 1 year | -$1,479 |
| -$80 | Net after 2 years | -$2,958 |
| -$85 | Net after 3 years | -$4,436 |
| Does not pay back at current rates (negative daily profit) | Payback period | — |
Projections assume continuous operation, a flat $0.10/kWh rate, and no hardware degradation, pool fees, or BTC price change. Real-world ROI varies.
Best For...
Best for Profitability
TieBoth miners produce similar daily profit.
Best for Home Mining
NerdAxeScore: 70/100. 30 dB noise level.
Best for Efficiency
NerdAxe24.0 J/TH — lower electricity cost per terahash.
Frequently Asked Questions
NerdAxe vs Innosilicon T3 39T: which one earns more per day?
At the current BTC price and a $0.10/kWh electricity rate, the NerdAxe is more profitable at $-0.01/day compared to $-4.05/day for the Innosilicon T3 39T. Profitability depends heavily on your electricity rate — use the selector above to calculate with your actual costs.
Is the NerdAxe or the Innosilicon T3 39T better for noise-sensitive spaces?
The NerdAxe is quieter at 30 dB compared to the Innosilicon T3 39T at 0 dB. For home mining, lower noise levels make a significant difference in livability.
For mining at home, should I pick the NerdAxe or the Innosilicon T3 39T?
The NerdAxe scores 70/100 on our Home Mining Score (vs 26/100 for the Innosilicon T3 39T). This composite score factors in noise, power requirements, heat output, size, and setup ease — all critical for residential mining.
NerdAxe vs Innosilicon T3 39T: how much does the efficiency gap matter?
The NerdAxe runs at 24.0 J/TH while the Innosilicon T3 39T runs at 55.1 J/TH — a difference of 31.1 J/TH. Lower efficiency means less electricity per terahash of mining power, directly reducing operating costs. In relative terms that is 56% better efficacité (24.0 vs 55.1 J/TH).
Compare NerdAxe with...
Compare Innosilicon T3 39T with...
- Innosilicon T3 39T vs Innosilicon A10 ETHMaster (500Mh)
- Innosilicon T3 39T vs Innosilicon A10 Pro ETH (500Mh)
- Innosilicon T3 39T vs Innosilicon A10 Pro+ ETH (750Mh)
- Innosilicon T3 39T vs Innosilicon A11 Pro
- Innosilicon T3 39T vs Innosilicon A11 Pro ETH (1500Mh)
- Innosilicon T3 39T vs Innosilicon A4 Dominator