

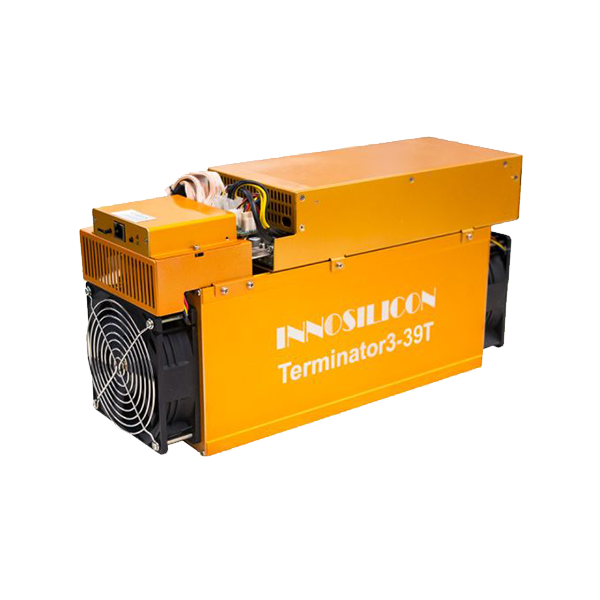
Innosilicon A11 Pro vs Innosilicon T3 39T
Side-by-side specs, profitability, and home mining comparison.
Specifications Comparison
| Innosilicon A11 Pro | Specification | Innosilicon T3 39T |
|---|---|---|
| 2,000.0 MH/s | Taux de hachage | 39.0 TH/s |
| 2,500 W | Consommation électrique | 2,150 W |
| 1,250,000.0 J/TH | Efficiency | 55.1 J/TH |
| 75 dB | Niveau de bruit | — |
| 22.0 kg | Weight | 8,650.0 kg |
| 8,530 BTU/hr | BTU Output | 7,336 BTU/hr |
| 40/100 | Home Mining Score | 26/100 |
| — | Release Year | — |
| EtHash | Algorithme | SHA-256 |
| Innosilicon | Manufacturer | Innosilicon |
Profitability Comparison
Innosilicon A11 Pro
Innosilicon T3 39T
Based on BTC price of $77,163 and current network difficulty as of May 25, 2026. Actual results vary.
Verdict
Selon notre analyse multifactorielle, le Innosilicon T3 39T l'emporte sur 3 des 5 facteurs (efficacité, hashrate, consommation électrique). Where it pulls away hardest is 100% better efficacité (1,250,000.0 vs 55.1 J/TH). The Innosilicon A11 Pro holds the edge in score de minage domestique and niveau sonore. The right pick still depends on your power cost and noise tolerance — the breakdowns above make that call concrete.
Spec Deltas
Stripped to the numbers, this is how far apart the Innosilicon A11 Pro and Innosilicon T3 39T sit on each measurable spec:
- Innosilicon T3 39T 1949900% more hashrate (0.0 vs 39.0 TH/s)
- Innosilicon T3 39T 14% better power draw (2,500 vs 2,150 W)
- Innosilicon T3 39T 100% better efficacité (1,250,000.0 vs 55.1 J/TH)
- Innosilicon A11 Pro 100% better weight (22.0 vs 8,650.0 kg)
- Innosilicon A11 Pro 16% more heat output (8,530 vs 7,336 BTU/hr)
- Innosilicon A11 Pro 54% more score de minage domestique (40.0 vs 26.0)
Cost & ROI Over Time
A miner pays for itself in profit, not specs. These projections track upfront cost against one, two and three years of net earnings at $0.10/kWh.
| Innosilicon A11 Pro | Metric | Innosilicon T3 39T |
|---|---|---|
| $4,000 | Upfront cost (MSRP) | — |
| -$6.00 | Daily net profit | -$3.78 |
| -$6,190 | Net after 1 year | -$1,378 |
| -$8,380 | Net after 2 years | -$2,756 |
| -$10,570 | Net after 3 years | -$4,134 |
| Does not pay back at current rates (negative daily profit) | Payback period | — |
Projections assume continuous operation, a flat $0.10/kWh rate, and no hardware degradation, pool fees, or BTC price change. Real-world ROI varies.
Best For...
Best for Profitability
TieBoth miners produce similar daily profit.
Best for Home Mining
Innosilicon A11 ProScore: 40/100. 75 dB noise level.
Best for Efficiency
Innosilicon T3 39T55.1 J/TH — lower electricity cost per terahash.
Frequently Asked Questions
Which makes more money, the Innosilicon A11 Pro or the Innosilicon T3 39T?
At the current BTC price and a $0.10/kWh electricity rate, the Innosilicon T3 39T is more profitable at $-3.78/day compared to $-6.00/day for the Innosilicon A11 Pro. Profitability depends heavily on your electricity rate — use the selector above to calculate with your actual costs.
Which is quieter, the Innosilicon A11 Pro or Innosilicon T3 39T?
The Innosilicon A11 Pro is quieter at 75 dB compared to the Innosilicon T3 39T at 0 dB. For home mining, lower noise levels make a significant difference in livability.
For mining at home, should I pick the Innosilicon A11 Pro or the Innosilicon T3 39T?
The Innosilicon A11 Pro scores 40/100 on our Home Mining Score (vs 26/100 for the Innosilicon T3 39T). This composite score factors in noise, power requirements, heat output, size, and setup ease — all critical for residential mining.
What is the efficiency difference between Innosilicon A11 Pro and Innosilicon T3 39T?
The Innosilicon A11 Pro runs at 1,250,000.0 J/TH while the Innosilicon T3 39T runs at 55.1 J/TH — a difference of 1,249,944.9 J/TH. Lower efficiency means less electricity per terahash of mining power, directly reducing operating costs. In relative terms that is 100% better efficacité (1,250,000.0 vs 55.1 J/TH).
Compare Innosilicon A11 Pro with...
- Innosilicon A11 Pro vs Innosilicon A10 ETHMaster (500Mh)
- Innosilicon A11 Pro vs Innosilicon A10 Pro ETH (500Mh)
- Innosilicon A11 Pro vs Innosilicon A10 Pro+ ETH (750Mh)
- Innosilicon A11 Pro vs Innosilicon A11 Pro ETH (1500Mh)
- Innosilicon A11 Pro vs Innosilicon A4 Dominator
- Innosilicon A11 Pro vs Innosilicon A4+ LTCMaster