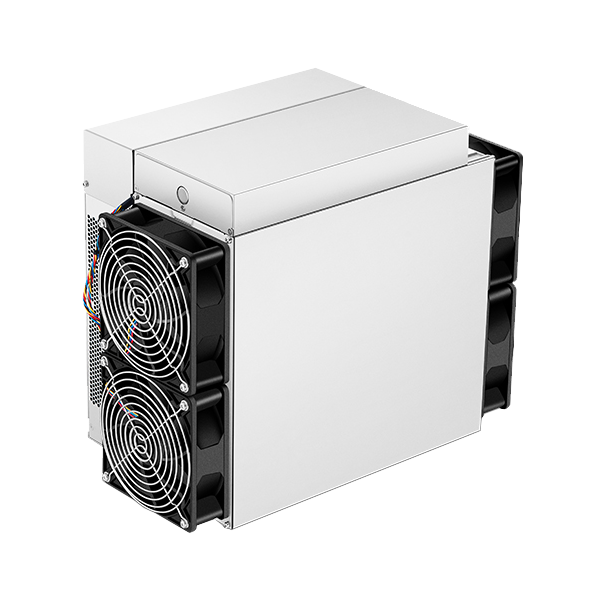
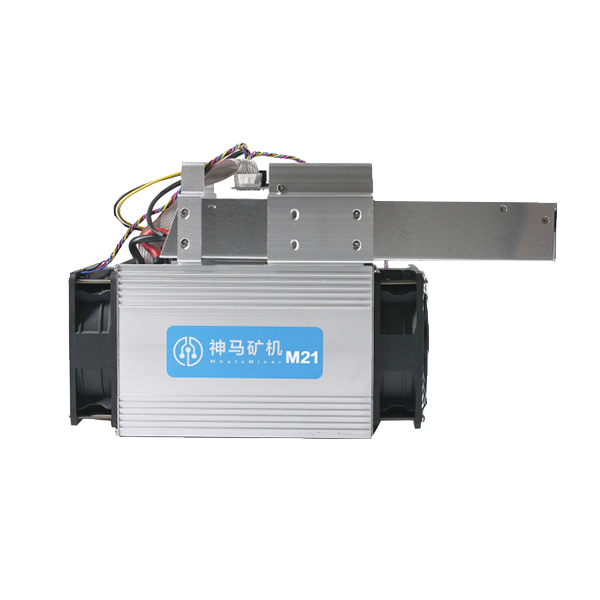
Antminer S19 Pro+ vs MicroBT Whatsminer M21
Side-by-side specs, profitability, and home mining comparison.
Specifications Comparison
| Antminer S19 Pro+ | Specification | MicroBT Whatsminer M21 |
|---|---|---|
| 120.0 TH/s | Hashrate | 31.0 TH/s |
| 3,360 W | Power Consumption | 1,860 W |
| 28.0 J/TH | Efficiency | 60.0 J/TH |
| 75 dB | Noise Level | — |
| 14.4 kg | Weight | 7,150.0 kg |
| 11,464 BTU/hr | BTU Output | 6,346 BTU/hr |
| 84/100 | Home Mining Score | 28/100 |
| — | Release Year | — |
| SHA-256 | Algorithm | SHA-256 |
| Bitmain | Manufacturer | MicroBT |
Profitability Comparison
Antminer S19 Pro+
MicroBT Whatsminer M21
Based on BTC price of $78,001 and current network difficulty as of May 16, 2026. Actual results vary.
Verdict
Our scoring model gives the nod to the Antminer S19 Pro+, which leads on 4 of 5 weighted factors (efficiency, hashrate, home mining score, noise level). The standout gap is 287% more hashrate (120.0 vs 31.0 TH/s) in the Antminer S19 Pro+'s favour. That said, the MicroBT Whatsminer M21 isn't beaten everywhere — it still wins power consumption. Review the detailed specs and profitability calculations above to determine which miner best fits your specific setup.
Spec Deltas
The Antminer S19 Pro+ and MicroBT Whatsminer M21 diverge on the metrics below — each gap expressed as a real percentage, not a vague "better":
- Antminer S19 Pro+ 287% more hashrate (120.0 vs 31.0 TH/s)
- MicroBT Whatsminer M21 45% better power draw (3,360 vs 1,860 W)
- Antminer S19 Pro+ 53% better efficiency (28.0 vs 60.0 J/TH)
- Antminer S19 Pro+ 100% better weight (14.4 vs 7,150.0 kg)
- Antminer S19 Pro+ 81% more heat output (11,464 vs 6,346 BTU/hr)
- Antminer S19 Pro+ 200% more home mining score (84.0 vs 28.0)
Cost & ROI Over Time
Sticker price versus what the miner actually earns back: the table below projects cumulative net profit at a $0.10/kWh electricity rate.
| Antminer S19 Pro+ | Metric | MicroBT Whatsminer M21 |
|---|---|---|
| $3,000 | Upfront cost (MSRP) | — |
| -$3.76 | Daily net profit | -$3.35 |
| -$4,371 | Net after 1 year | -$1,223 |
| -$5,742 | Net after 2 years | -$2,446 |
| -$7,114 | Net after 3 years | -$3,670 |
| Does not pay back at current rates (negative daily profit) | Payback period | — |
Projections assume continuous operation, a flat $0.10/kWh rate, and no hardware degradation, pool fees, or BTC price change. Real-world ROI varies.
Best For...
Best for Profitability
TieBoth miners produce similar daily profit.
Best for Home Mining
Antminer S19 Pro+Score: 84/100. 75 dB noise level.
Best for Efficiency
Antminer S19 Pro+28.0 J/TH — lower electricity cost per terahash.
Frequently Asked Questions
Antminer S19 Pro+ vs MicroBT Whatsminer M21: which one earns more per day?
At the current BTC price and a $0.10/kWh electricity rate, the MicroBT Whatsminer M21 is more profitable at $-3.35/day compared to $-3.76/day for the Antminer S19 Pro+. Profitability depends heavily on your electricity rate — use the selector above to calculate with your actual costs.
Which is quieter, the Antminer S19 Pro+ or MicroBT Whatsminer M21?
The Antminer S19 Pro+ is quieter at 75 dB compared to the MicroBT Whatsminer M21 at 0 dB. For home mining, lower noise levels make a significant difference in livability.
Antminer S19 Pro+ vs MicroBT Whatsminer M21: which fits a residential setup better?
The Antminer S19 Pro+ scores 84/100 on our Home Mining Score (vs 28/100 for the MicroBT Whatsminer M21). This composite score factors in noise, power requirements, heat output, size, and setup ease — all critical for residential mining.
How far apart are the Antminer S19 Pro+ and MicroBT Whatsminer M21 on J/TH?
The Antminer S19 Pro+ runs at 28.0 J/TH while the MicroBT Whatsminer M21 runs at 60.0 J/TH — a difference of 32.0 J/TH. Lower efficiency means less electricity per terahash of mining power, directly reducing operating costs. In relative terms that is 53% better efficiency (28.0 vs 60.0 J/TH).