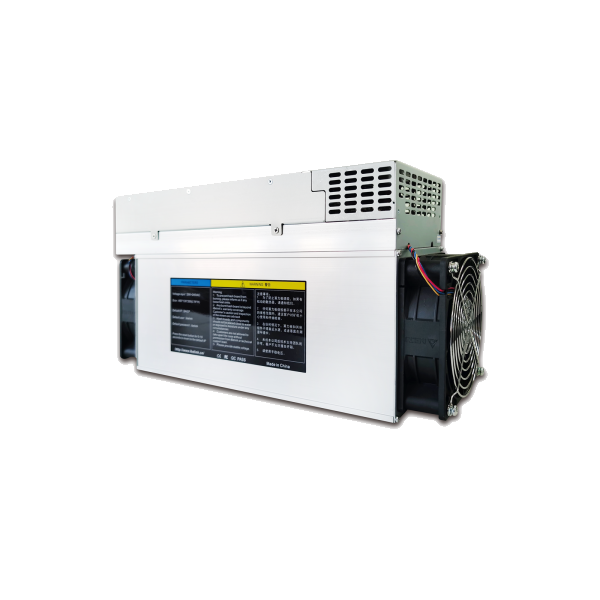
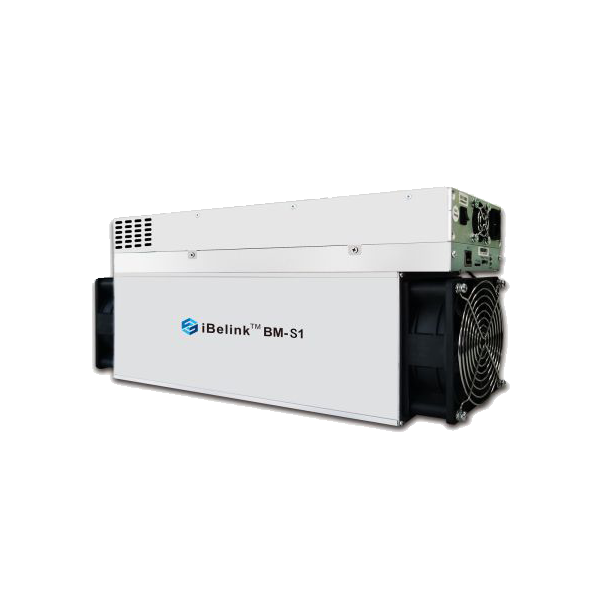
iBeLink BM-K1 Max vs iBeLink BM-S1
Side-by-side specs, profitability, and home mining comparison.
Specifications Comparison
| iBeLink BM-K1 Max | Specification | iBeLink BM-S1 |
|---|---|---|
| 32.0 TH/s | Hashrate | 6.8 TH/s |
| 3,200 W | Power Consumption | 2,350 W |
| 100.0 J/TH | Efficiency | 345.6 J/TH |
| — | Noise Level | — |
| 12,200.0 kg | Weight | 9,000.0 kg |
| 10,918 BTU/hr | BTU Output | 8,018 BTU/hr |
| 22/100 | Home Mining Score | 26/100 |
| — | Release Year | — |
| Blake2s | Algorithm | Blake2b-sia |
| iBeLink | Manufacturer | iBeLink |
Profitability Comparison
iBeLink BM-K1 Max
iBeLink BM-S1
Based on BTC price of $76,932 and current network difficulty as of May 18, 2026. Actual results vary.
Verdict
Our scoring model gives the nod to the iBeLink BM-K1 Max, which leads on 3 of 5 weighted factors (efficiency, hashrate, price-performance). The standout gap is 371% more hashrate (32.0 vs 6.8 TH/s) in the iBeLink BM-K1 Max's favour. That said, the iBeLink BM-S1 isn't beaten everywhere — it still wins power consumption and home mining score. The right pick still depends on your power cost and noise tolerance — the breakdowns above make that call concrete.
Spec Deltas
Here is every spec where the iBeLink BM-K1 Max and iBeLink BM-S1 actually differ, with the gap quantified:
- iBeLink BM-K1 Max 371% more hashrate (32.0 vs 6.8 TH/s)
- iBeLink BM-S1 27% better power draw (3,200 vs 2,350 W)
- iBeLink BM-K1 Max 71% better efficiency (100 vs 346 J/TH)
- iBeLink BM-S1 26% better weight (12,200 vs 9,000 kg)
- iBeLink BM-K1 Max 36% more heat output (10,918 vs 8,018 BTU/hr)
- iBeLink BM-S1 18% more home mining score (22.0 vs 26.0)
Cost & ROI Over Time
A miner pays for itself in profit, not specs. These projections track upfront cost against one, two and three years of net earnings at $0.10/kWh.
| iBeLink BM-K1 Max | Metric | iBeLink BM-S1 |
|---|---|---|
| $1,250 | Upfront cost (MSRP) | $768 |
| -$6.55 | Daily net profit | -$5.40 |
| -$3,640 | Net after 1 year | -$2,739 |
| -$6,029 | Net after 2 years | -$4,709 |
| -$8,419 | Net after 3 years | -$6,680 |
| Does not pay back at current rates (negative daily profit) | Payback period | Does not pay back at current rates (negative daily profit) |
Projections assume continuous operation, a flat $0.10/kWh rate, and no hardware degradation, pool fees, or BTC price change. Real-world ROI varies.
Best For...
Best for Profitability
TieBoth miners produce similar daily profit.
Best for Home Mining
iBeLink BM-S1Score: 26/100. 0 dB noise level.
Best for Efficiency
iBeLink BM-K1 Max100.0 J/TH — lower electricity cost per terahash.
Frequently Asked Questions
Which makes more money, the iBeLink BM-K1 Max or the iBeLink BM-S1?
At the current BTC price and a $0.10/kWh electricity rate, the iBeLink BM-S1 is more profitable at $-5.40/day compared to $-6.55/day for the iBeLink BM-K1 Max. Profitability depends heavily on your electricity rate — use the selector above to calculate with your actual costs.
Is the iBeLink BM-K1 Max or the iBeLink BM-S1 better for noise-sensitive spaces?
Both miners have similar noise levels. Check the specs table above for exact decibel readings.
For mining at home, should I pick the iBeLink BM-K1 Max or the iBeLink BM-S1?
The iBeLink BM-S1 scores 26/100 on our Home Mining Score (vs 22/100 for the iBeLink BM-K1 Max). This composite score factors in noise, power requirements, heat output, size, and setup ease — all critical for residential mining.
What is the efficiency difference between iBeLink BM-K1 Max and iBeLink BM-S1?
The iBeLink BM-K1 Max runs at 100.0 J/TH while the iBeLink BM-S1 runs at 345.6 J/TH — a difference of 245.6 J/TH. Lower efficiency means less electricity per terahash of mining power, directly reducing operating costs. In relative terms that is 71% better efficiency (100 vs 346 J/TH).