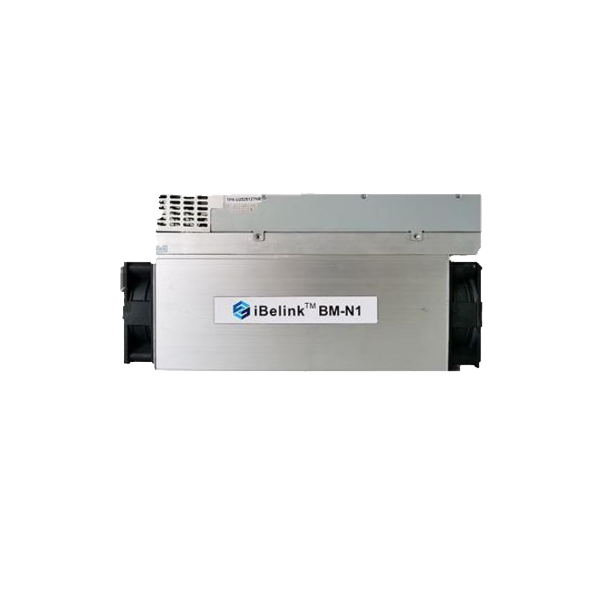
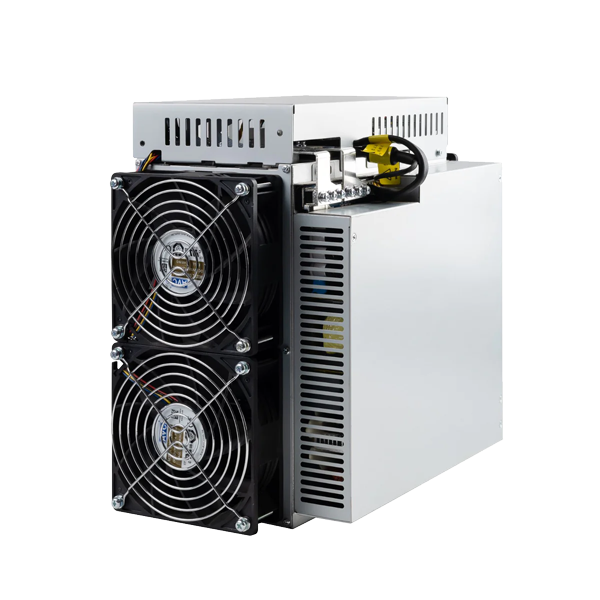
iBeLink BM-N1 vs iBeLink BM-S3 Siacoin Miner
Side-by-side specs, profitability, and home mining comparison.
Specifications Comparison
| iBeLink BM-N1 | Specification | iBeLink BM-S3 Siacoin Miner |
|---|---|---|
| 6.6 TH/s | Hashrate | 19.0 TH/s |
| 2,400 W | Power Consumption | 3,100 W |
| 363.6 J/TH | Efficiency | 163.2 J/TH |
| — | Noise Level | 75 dB |
| 9,900.0 kg | Weight | 14.0 kg |
| 8,189 BTU/hr | BTU Output | 10,577 BTU/hr |
| 26/100 | Home Mining Score | 36/100 |
| — | Release Year | — |
| Eaglesong | Algorithm | Blake2b-sia |
| iBeLink | Manufacturer | iBeLink |
Profitability Comparison
iBeLink BM-N1
iBeLink BM-S3 Siacoin Miner
Based on BTC price of $76,908 and current network difficulty as of May 18, 2026. Actual results vary.
Verdict
Based on our multi-factor analysis, the iBeLink BM-S3 Siacoin Miner wins on 4 of 5 factors (efficiency, hashrate, home mining score, noise level). Where it pulls away hardest is 188% more hashrate (6.6 vs 19.0 TH/s). The iBeLink BM-N1 holds the edge in power consumption. Review the detailed specs and profitability calculations above to determine which miner best fits your specific setup.
Spec Deltas
The iBeLink BM-N1 and iBeLink BM-S3 Siacoin Miner diverge on the metrics below — each gap expressed as a real percentage, not a vague "better":
- iBeLink BM-S3 Siacoin Miner 188% more hashrate (6.6 vs 19.0 TH/s)
- iBeLink BM-N1 23% better power draw (2,400 vs 3,100 W)
- iBeLink BM-S3 Siacoin Miner 55% better efficiency (364 vs 163 J/TH)
- iBeLink BM-S3 Siacoin Miner 100% better weight (9,900.0 vs 14.0 kg)
- iBeLink BM-S3 Siacoin Miner 29% more heat output (8,189 vs 10,577 BTU/hr)
- iBeLink BM-S3 Siacoin Miner 38% more home mining score (26.0 vs 36.0)
Cost & ROI Over Time
A miner pays for itself in profit, not specs. These projections track upfront cost against one, two and three years of net earnings at $0.10/kWh.
| iBeLink BM-N1 | Metric | iBeLink BM-S3 Siacoin Miner |
|---|---|---|
| — | Upfront cost (MSRP) | $1,330 |
| -$5.53 | Daily net profit | -$6.77 |
| -$2,017 | Net after 1 year | -$3,800 |
| -$4,034 | Net after 2 years | -$6,270 |
| -$6,051 | Net after 3 years | -$8,740 |
| — | Payback period | Does not pay back at current rates (negative daily profit) |
Projections assume continuous operation, a flat $0.10/kWh rate, and no hardware degradation, pool fees, or BTC price change. Real-world ROI varies.
Best For...
Best for Profitability
TieBoth miners produce similar daily profit.
Best for Home Mining
iBeLink BM-S3 Siacoin MinerScore: 36/100. 75 dB noise level.
Best for Efficiency
iBeLink BM-S3 Siacoin Miner163.2 J/TH — lower electricity cost per terahash.
Frequently Asked Questions
iBeLink BM-N1 vs iBeLink BM-S3 Siacoin Miner: which one earns more per day?
At the current BTC price and a $0.10/kWh electricity rate, the iBeLink BM-N1 is more profitable at $-5.53/day compared to $-6.77/day for the iBeLink BM-S3 Siacoin Miner. Profitability depends heavily on your electricity rate — use the selector above to calculate with your actual costs.
iBeLink BM-N1 vs iBeLink BM-S3 Siacoin Miner: which runs at a lower noise level?
The iBeLink BM-S3 Siacoin Miner is quieter at 75 dB compared to the iBeLink BM-N1 at 0 dB. For home mining, lower noise levels make a significant difference in livability.
Which is better for home mining, the iBeLink BM-N1 or iBeLink BM-S3 Siacoin Miner?
The iBeLink BM-S3 Siacoin Miner scores 36/100 on our Home Mining Score (vs 26/100 for the iBeLink BM-N1). This composite score factors in noise, power requirements, heat output, size, and setup ease — all critical for residential mining.
How far apart are the iBeLink BM-N1 and iBeLink BM-S3 Siacoin Miner on J/TH?
The iBeLink BM-N1 runs at 363.6 J/TH while the iBeLink BM-S3 Siacoin Miner runs at 163.2 J/TH — a difference of 200.5 J/TH. Lower efficiency means less electricity per terahash of mining power, directly reducing operating costs. In relative terms that is 55% better efficiency (364 vs 163 J/TH).